OPEN-SOURCE SCRIPT
업데이트됨 Enhanced stochastic Momentum Oscillator with signals
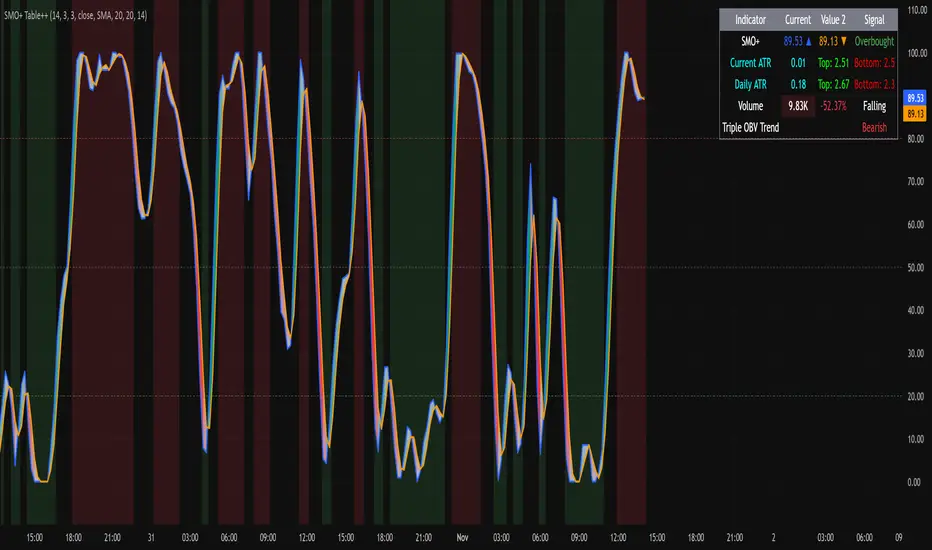
Overall Benefits of This Enhanced SMO Script
Fully Customizable Inputs – period, smoothing type, source, and colors.
Gradient Momentum Ribbon – visually communicates strength and direction.
Overbought/Oversold Highlights – both lines and background for clarity.
Alert System Built-In – monitors crossovers and zone entries/exits.
Error-Resistant Calculations – prevents division by zero, avoids Pine v5 multi-line ternary issues.
Highly Visual – suitable for quick decision-making, not just raw numbers.
Flexible for Any Timeframe – can be used on multi-timeframe analysis.
Table that shows current condition (neutral, overbought and oversold)
Try with my other indicator highlighted in picture-
릴리즈 노트
Update 2.0Updated to Version 6
Added volume information for direction confirmation and strength;
Volume row with spike highlighting
OBV row with % change
Triple OBV row showing Bullish/Bearish/Neutral under Status
How to implement the strategy
Identify the pattern: Look for a triple top, where an asset's price reaches approximately the same high level three times, with a low point between each peak.
Analyze volume during the peaks: Observe the On-Balance Volume (OBV) indicator during these peaks.
Bearish divergence: If the price makes a new high on the third peak, but the OBV makes a lower high, this is a bearish divergence. This indicates that even though the price is rising, the volume behind the move is decreasing, suggesting that buying pressure is weakening.
Strong trend confirmation: If the price makes a new high on the third peak and the OBV also makes a new high, it confirms the strength of the uptrend and the strategy might not be appropriate at that time.
Confirm the reversal:
If you see the bearish divergence (higher price, lower OBV on the third peak), wait for confirmation. A common confirmation is for the price to break below a support level that formed between the peaks.
The OBV line itself may also break a previous support level during this period.
Enter a short position: Once the price breaks the support level, consider entering a short position, as the triple top pattern combined with the OBV divergence suggests a reversal is likely.
릴리즈 노트
Update 3.0 Added a “Sentiment” row that evaluates market bias based on:
SMO+: Overbought / Oversold
Volume: Rising / Falling / Spike
Triple OBV: Bullish / Bearish / Neutral
Simple scoring system:
Bullish sentiment if:
SMO+ is oversold (k < 20) or near midline rising
Volume is rising
Triple OBV is bullish
Bearish sentiment if:
SMO+ is overbought (k > 80) or midline falling
Volume is falling
Triple OBV is bearish
Otherwise: Neutral
릴리즈 노트
Update 4.0Simplified text box to combine K and D overbought and oversold signals
Current ATR (based on chart timeframe)
Daily ATR (from 1D timeframe)
Current ATR Top / Bottom levels
Daily ATR Top / Bottom levels
Integrated into a clean expanded table layout
릴리즈 노트
Minor tweaks 릴리즈 노트
bug fixes오픈 소스 스크립트
진정한 트레이딩뷰 정신에 따라 이 스크립트 작성자는 트레이더가 기능을 검토하고 검증할 수 있도록 오픈소스로 공개했습니다. 작성자에게 찬사를 보냅니다! 무료로 사용할 수 있지만 코드를 다시 게시할 경우 하우스 룰이 적용된다는 점을 기억하세요.
Want to join a safe community full of like-minded individuals that work together, not against each other? Join Xtrader! Link for more amazing indicators and support.
discord.gg/NHjztdYv6U
discord.gg/NHjztdYv6U
면책사항
이 정보와 게시물은 TradingView에서 제공하거나 보증하는 금융, 투자, 거래 또는 기타 유형의 조언이나 권고 사항을 의미하거나 구성하지 않습니다. 자세한 내용은 이용 약관을 참고하세요.
오픈 소스 스크립트
진정한 트레이딩뷰 정신에 따라 이 스크립트 작성자는 트레이더가 기능을 검토하고 검증할 수 있도록 오픈소스로 공개했습니다. 작성자에게 찬사를 보냅니다! 무료로 사용할 수 있지만 코드를 다시 게시할 경우 하우스 룰이 적용된다는 점을 기억하세요.
Want to join a safe community full of like-minded individuals that work together, not against each other? Join Xtrader! Link for more amazing indicators and support.
discord.gg/NHjztdYv6U
discord.gg/NHjztdYv6U
면책사항
이 정보와 게시물은 TradingView에서 제공하거나 보증하는 금융, 투자, 거래 또는 기타 유형의 조언이나 권고 사항을 의미하거나 구성하지 않습니다. 자세한 내용은 이용 약관을 참고하세요.