PROTECTED SOURCE SCRIPT
VIX Analytics
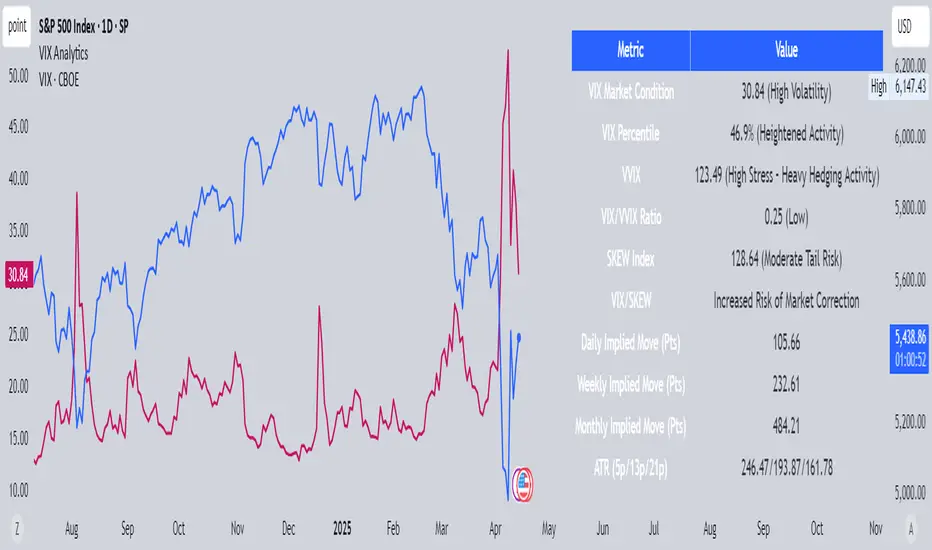
This script is designed to serve traders, analysts, and investors who want a real-time, comprehensive view of market volatility, risk sentiment, and implied movements. It combines multiple institutional-grade volatility indices into one clear dashboard and interprets them with actionable insights — directly on your chart.
🔍 Features Included
🟦VIX (CBOE Volatility Index)
Measures market expectation of 30-day S&P 500 volatility.
Color-coded interpretation ranges:
Under 13: Extreme Complacency
15–20: Stable Market
20–30: Moderate Risk
30–40: High Volatility
Over 40: Panic
🟪 VVIX (Volatility of Volatility Index)
Tracks the volatility of VIX itself.
Interpreted as a risk gauge of how aggressively traders are hedging volatility exposure.
Under 80: Market Complacency
80–100: Normal Environment
100–120: Caution — Rising Volatility of Volatility
Over 120: High Stress — Elevated Hedging Activity
🟨 SKEW Index
Measures the perceived tail risk of the S&P 500 — i.e., the probability of a black swan event.
Below 110: Potential Complacency
120–140: Moderate Tail Risk
Above 140: High Tail Risk
🧮 VIX/VVIX Ratio
Gauges relative fear levels between expected volatility and the volatility of volatility.
Under 0.5: Low Ratio — VVIX Overextended
Over 0.9: High Ratio — VIX Leading
📈 VIX Percentile (1-Year Range)
Shows where the current VIX sits relative to its 1-year high/low.
Under 20%: Volatility is Cheap
Over 70%: Fear is Elevated — Reversal Possible
📉 SPX Implied Point Moves
Projects expected moves in SPX using VIX-derived volatility:
Daily
Weekly
Monthly
Helps size positions or define expected price ranges based on volatility regime.
📊 ATR Values (5, 13, 21 periods)
Traditional volatility using historical prices.
Provided alongside implied data for comparison.
🧠 Unique Logic & Interpretation Layer
This script doesn’t just show raw data — it interprets it. It reads the relationship between VIX, VVIX, and SKEW to highlight:
When market volatility may be underpriced
When hidden tail risks are forming
When to be cautious of volatility expansions
How current implied movement compares to past realized volatility
✅ Use Cases
Day traders: Know when volatility is low or expanding before scalping or swinging.
Options traders: Identify whether implied volatility is cheap or expensive.
Portfolio managers: Gauge when hedging is in demand and adjust exposure.
Risk managers: Crosscheck if current volatility aligns with macro risk events.
⚙️ Settings
Customizable table placement: Move the dashboard to any corner of your chart.
No repainting or lag: Data updates in real-time using official CBOE and SPX feeds.
보호된 스크립트입니다
이 스크립트는 비공개 소스로 게시됩니다. 하지만 이를 자유롭게 제한 없이 사용할 수 있습니다 – 자세한 내용은 여기에서 확인하세요.
면책사항
해당 정보와 게시물은 금융, 투자, 트레이딩 또는 기타 유형의 조언이나 권장 사항으로 간주되지 않으며, 트레이딩뷰에서 제공하거나 보증하는 것이 아닙니다. 자세한 내용은 이용 약관을 참조하세요.
보호된 스크립트입니다
이 스크립트는 비공개 소스로 게시됩니다. 하지만 이를 자유롭게 제한 없이 사용할 수 있습니다 – 자세한 내용은 여기에서 확인하세요.
면책사항
해당 정보와 게시물은 금융, 투자, 트레이딩 또는 기타 유형의 조언이나 권장 사항으로 간주되지 않으며, 트레이딩뷰에서 제공하거나 보증하는 것이 아닙니다. 자세한 내용은 이용 약관을 참조하세요.