OPEN-SOURCE SCRIPT
Smooth RSI [MarktQuant]
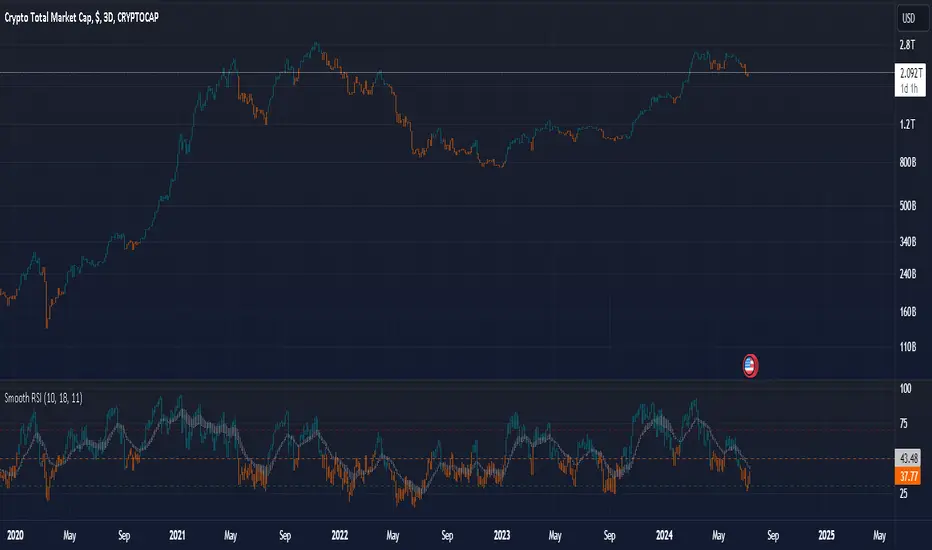
This Smooth RSI offers a nuanced analysis of the Relative Strength Index (RSI) by smoothing it through multiple averaging techniques. It provides additional insights into market movements and potential trading signals.
Key Features:
1. RSI Calculation:
- Calculates the RSI for high, open, low, and close prices over a user-defined period.
- Averages these four RSI values to derive a smoothed RSI.
2. Exponential Moving Average (EMA) of RSI:
- Applies an EMA to each of the four RSI values over a user-defined period.
- Averages these EMA values to produce a smoothed EMA of RSI.
3. Rate of Change (RoC) Calculation:
- Computes the Rate of Change for high, open, low, and close prices over a user-defined period (`lengthc`).
- Averages these four RoC values to generate a smoothed RoC (`sumc`).
- Colors the RoC bars based on their value: positive (green) or negative (red).
4. Trend Indication:
- Identifies long signals when the smoothed RSI is above 50.
- Identifies short signals when the smoothed RSI is below 50.
- Highlights bullish conditions when both long signals and positive RoC are present.
- Highlights bearish conditions when both short signals and negative RoC are present.
5. Visual Elements:
- Bar colors change to teal for bullish conditions and orange for bearish conditions.
- Horizontal lines at 30, 50, and 70 mark key RSI levels.
- Candlestick plots of the smoothed RSI, EMA of RSI, and RoC.
6. Customization Options:
- Toggle visibility of RSI, EMA of RSI, and RoC candlestick plots through input settings in the "Plot Settings" group.
Usage:
- This indicator can be used to smooth out the traditional RSI signals, providing a clearer view of the market's momentum.
- The EMA and RoC components add additional layers of analysis, helping traders confirm trends and potential reversals.
- The color-coded bars and plot lines visually highlight critical levels and conditions, making it easier to interpret the market's behavior at a glance.
This "Smooth RSI" indicator is an advanced tool designed to enhance your technical analysis, offering a refined approach to understanding price momentum and trend strength.
오픈 소스 스크립트
트레이딩뷰의 진정한 정신에 따라, 이 스크립트의 작성자는 이를 오픈소스로 공개하여 트레이더들이 기능을 검토하고 검증할 수 있도록 했습니다. 작성자에게 찬사를 보냅니다! 이 코드는 무료로 사용할 수 있지만, 코드를 재게시하는 경우 하우스 룰이 적용된다는 점을 기억하세요.
🔍 Access Investing Strategies & Indicators
📊 whop.com/marktquant
🌐 marktquant.com
Nothing shared on this page constitutes financial advice. All information, tools, and analyses are provided solely for informational and educational purposes.
📊 whop.com/marktquant
🌐 marktquant.com
Nothing shared on this page constitutes financial advice. All information, tools, and analyses are provided solely for informational and educational purposes.
면책사항
해당 정보와 게시물은 금융, 투자, 트레이딩 또는 기타 유형의 조언이나 권장 사항으로 간주되지 않으며, 트레이딩뷰에서 제공하거나 보증하는 것이 아닙니다. 자세한 내용은 이용 약관을 참조하세요.