OPEN-SOURCE SCRIPT
Dual EMA Trend Ribbon (Multi-Timeframe Trend Confirmation)
Dual EMA Trend Ribbon (Multi-Timeframe Trend Confirmation)
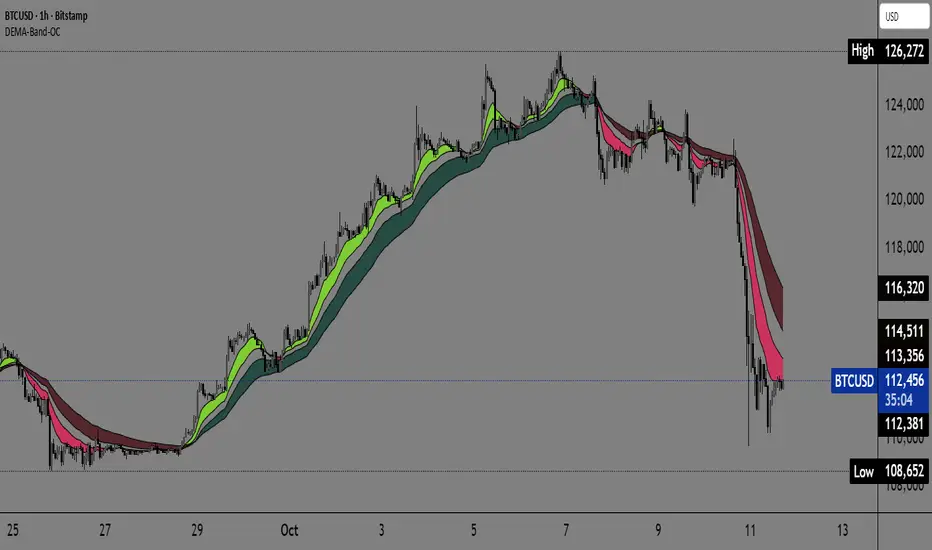
This Pine Script indicator creates a visually clear representation of trend direction using two overlaid Exponential Moving Average (EMA) Ribbons, which allows traders to assess both short-term and medium-term momentum at a glance.
How It Works:
The indicator plots two separate EMA ribbons, each calculated using a distinct set of periods, simulating a multi-timeframe approach on a single chart:
Inner (Fast) Ribbon (Defaults 10/30): Represents the fast-moving, short-term trend.
Green: Fast EMA 1 > Slow EMA 1 (Short-term Bullish)
Red: Fast EMA 1 < Slow EMA 1 (Short-term Bearish)
Outer (Slow) Ribbon (Defaults 40/50): Represents the slower, medium-term trend.
Darker Green/Red: Indicates the overall, underlying market bias.
How to Use:
Strong Trend Confirmation: A strong signal occurs when both ribbons are aligned (e.g., both are Green). This suggests that short-term momentum aligns with the medium-term bias.
Trend Weakness/Reversal: Pay attention when the two ribbons cross or when the fast ribbon changes color against the slow ribbon's color (e.g., fast ribbon turns Red while the slow ribbon remains Green). This often signals a temporary pullback or potential reversal of the underlying trend.
Settings: Users can easily adjust the four input periods (Fast EMA 1, Slow EMA 1, Fast EMA 2, Slow EMA 2) to customize the sensitivity to any trading style or asset.
오픈 소스 스크립트
트레이딩뷰의 진정한 정신에 따라, 이 스크립트의 작성자는 이를 오픈소스로 공개하여 트레이더들이 기능을 검토하고 검증할 수 있도록 했습니다. 작성자에게 찬사를 보냅니다! 이 코드는 무료로 사용할 수 있지만, 코드를 재게시하는 경우 하우스 룰이 적용된다는 점을 기억하세요.
Free telegram channel t.me/alexmasterforex
면책사항
해당 정보와 게시물은 금융, 투자, 트레이딩 또는 기타 유형의 조언이나 권장 사항으로 간주되지 않으며, 트레이딩뷰에서 제공하거나 보증하는 것이 아닙니다. 자세한 내용은 이용 약관을 참조하세요.