OPEN-SOURCE SCRIPT
Institutional Levels (Whole, Half, Quarter) By Capitalwithcaleb

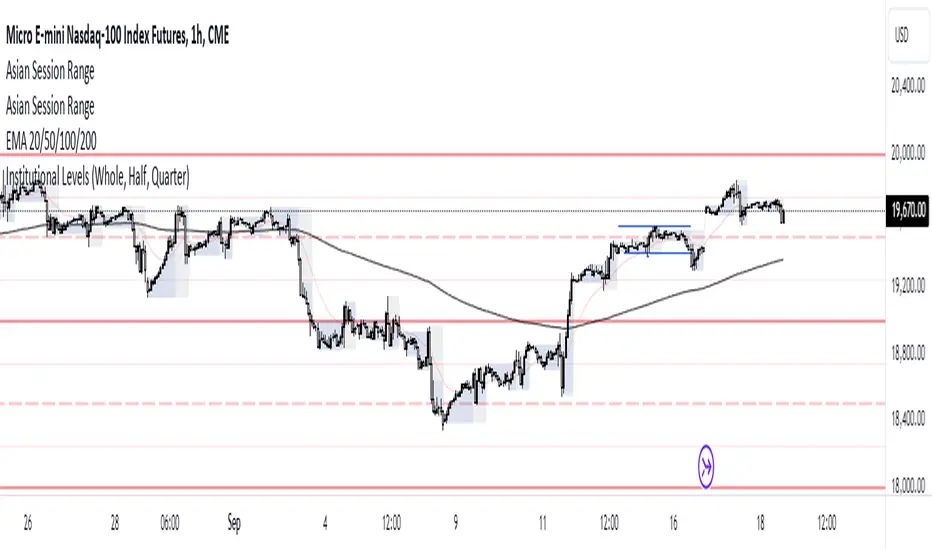
This Pine Script indicator is designed to plot institutional levels, which are key price levels that traders often monitor. These levels include whole numbers (like 12000, 12500), half levels (like 12250), and quarter levels (like 12375). The script allows full customization of colors, line styles, and line widths for each type of level (whole, half, and quarter).
Key Features:
Range of Levels:
The user defines a minimum (minLevel) and maximum (maxLevel) price level, and the script plots levels in increments of 50 points (step size of 50 covers quarter, half, and whole levels).
Customizable Appearance:
Color Customization: You can choose separate colors for whole, half, and quarter levels.
Line Style Customization: You can choose between solid, dashed, or dotted lines for each level type (whole, half, and quarter).
Line Width Customization: You can adjust the width of the lines (1 to 5).
Automatic Level Detection:
The script automatically determines whether a level is a whole, half, or quarter level based on whether it is a multiple of 1000 (whole), 500 (half), or 250 (quarter).
Plotting of Lines:
It draws horizontal lines across the entire chart (extend.both) at the calculated levels.
For each level, it determines its type (whole, half, quarter) and plots it using the user-specified colors, line styles, and widths.
Functions:
getLineStyle(styleStr): A functional helper that converts the string input from the user ("Solid", "Dashed", "Dotted") into Pine Script's corresponding line style constants.
plotLevel(level, color, width, style): Another functional helper that plots a line at the given price level with the provided color, width, and line style.
Execution Flow:
User Input: The user specifies the minimum and maximum levels to display on the chart. They also configure the appearance of the lines (color, style, width).
Level Calculation: The script iterates over all levels between the minLevel and maxLevel with a step size of 50, checking if the level is a whole, half, or quarter level.
Line Plotting: The appropriate lines are drawn on the chart, based on the type of level and user settings.
Example Use Case:
If a user sets the minLevel to 12000 and maxLevel to 13000, the script will automatically plot lines at key institutional levels like:
12000 (whole), 12250 (quarter), 12500 (whole), 12750 (quarter), etc.
오픈 소스 스크립트
트레이딩뷰의 진정한 정신에 따라, 이 스크립트의 작성자는 이를 오픈소스로 공개하여 트레이더들이 기능을 검토하고 검증할 수 있도록 했습니다. 작성자에게 찬사를 보냅니다! 이 코드는 무료로 사용할 수 있지만, 코드를 재게시하는 경우 하우스 룰이 적용된다는 점을 기억하세요.
면책사항
해당 정보와 게시물은 금융, 투자, 트레이딩 또는 기타 유형의 조언이나 권장 사항으로 간주되지 않으며, 트레이딩뷰에서 제공하거나 보증하는 것이 아닙니다. 자세한 내용은 이용 약관을 참조하세요.
오픈 소스 스크립트
트레이딩뷰의 진정한 정신에 따라, 이 스크립트의 작성자는 이를 오픈소스로 공개하여 트레이더들이 기능을 검토하고 검증할 수 있도록 했습니다. 작성자에게 찬사를 보냅니다! 이 코드는 무료로 사용할 수 있지만, 코드를 재게시하는 경우 하우스 룰이 적용된다는 점을 기억하세요.
면책사항
해당 정보와 게시물은 금융, 투자, 트레이딩 또는 기타 유형의 조언이나 권장 사항으로 간주되지 않으며, 트레이딩뷰에서 제공하거나 보증하는 것이 아닙니다. 자세한 내용은 이용 약관을 참조하세요.