INVITE-ONLY SCRIPT
RSI5 Multi Time Frame Indicator
Created by Andrew Palladino.
Date of Creation: 12/13/2016
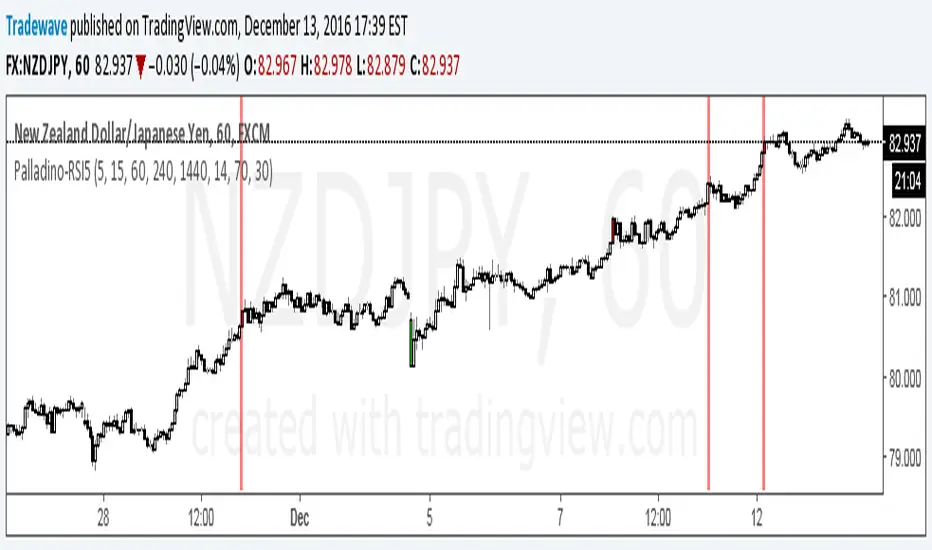
Checks overbought or oversold conditions across 5 time frames.
If Time frame 1, 2 and 3 are all overbought then bar color changes to red
If Time frame 1, 2 and 3 are all oversold then bar color changes to green
If Time frame 1, 2, 3, 4 and 5 are all overbought then a vertical red line is added to the plot
If Time frame 1, 2, 3, 4 and 5 are all oversold then a vertical green line is added to the plot
The user has the ability to change:
1) Any of the 5 time frames (Set in minutes: m5 = 5, m15 = 15, h1 = 60, h4 = 240, D = 1440...)
2) RSI overbought threshold Level
3) RSI oversold threshold Level
4) RSI Period
Date of Creation: 12/13/2016
Checks overbought or oversold conditions across 5 time frames.
If Time frame 1, 2 and 3 are all overbought then bar color changes to red
If Time frame 1, 2 and 3 are all oversold then bar color changes to green
If Time frame 1, 2, 3, 4 and 5 are all overbought then a vertical red line is added to the plot
If Time frame 1, 2, 3, 4 and 5 are all oversold then a vertical green line is added to the plot
The user has the ability to change:
1) Any of the 5 time frames (Set in minutes: m5 = 5, m15 = 15, h1 = 60, h4 = 240, D = 1440...)
2) RSI overbought threshold Level
3) RSI oversold threshold Level
4) RSI Period
초대 전용 스크립트
이 스크립트는 작성자가 승인한 사용자만 접근할 수 있습니다. 사용하려면 요청 후 승인을 받아야 하며, 일반적으로 결제 후에 허가가 부여됩니다. 자세한 내용은 아래 작성자의 안내를 따르거나 LiquidityTracker에게 직접 문의하세요.
트레이딩뷰는 스크립트의 작동 방식을 충분히 이해하고 작성자를 완전히 신뢰하지 않는 이상, 해당 스크립트에 비용을 지불하거나 사용하는 것을 권장하지 않습니다. 커뮤니티 스크립트에서 무료 오픈소스 대안을 찾아보실 수도 있습니다.
작성자 지시 사항
면책사항
해당 정보와 게시물은 금융, 투자, 트레이딩 또는 기타 유형의 조언이나 권장 사항으로 간주되지 않으며, 트레이딩뷰에서 제공하거나 보증하는 것이 아닙니다. 자세한 내용은 이용 약관을 참조하세요.