OPEN-SOURCE SCRIPT
PnL Tracker
This script allows you to manually input the details for up to 64 unique positions in the settings, each requiring a Symbol, Average Cost, and Quantity (Qty).
Key Features:
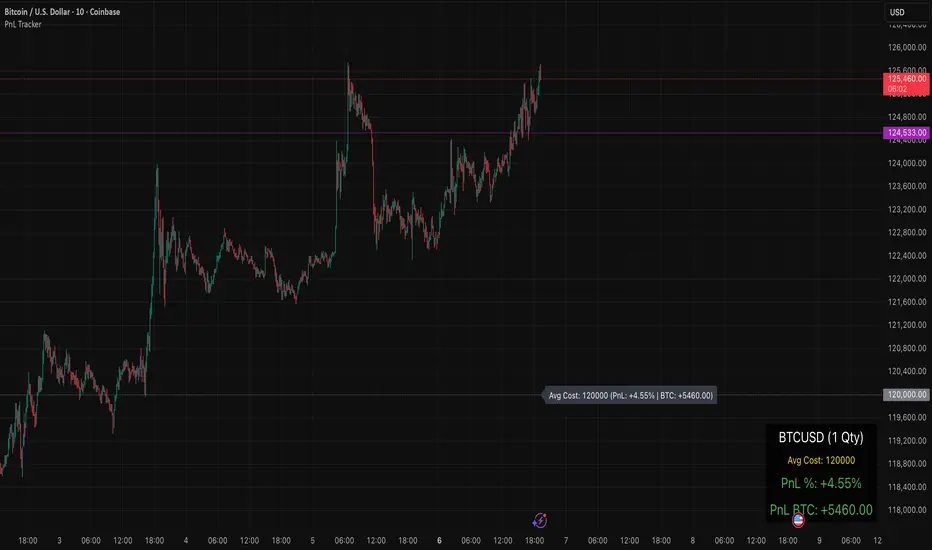
Average Cost Line: Plots a horizontal line on the chart corresponding to your recorded Average Cost for the security currently being viewed.
Real-Time PnL Label: A dynamic label attached to the Average Cost line provides an instant summary of your PnL in both percentage and currency for the last visible bar.
Detailed PnL Box: Displays a consolidated, easy-to-read table in the bottom-right corner of the chart, clearly showing:
The Symbol and Quantity of your position.
Your Average Cost.
The current PnL in percentage (%) and base currency (e.g., USD, EUR).
Visibility Controls: Toggles in the settings allow you to show or hide the Average Cost line and the PnL summary box independently.
This tool is perfect for actively managing and visualizing your multi-asset portfolio positions without leaving your main trading chart. Simply enter your positions in the indicator's settings, and the script will automatically track the PnL for the symbol matching the current chart.
Key Features:
Average Cost Line: Plots a horizontal line on the chart corresponding to your recorded Average Cost for the security currently being viewed.
Real-Time PnL Label: A dynamic label attached to the Average Cost line provides an instant summary of your PnL in both percentage and currency for the last visible bar.
Detailed PnL Box: Displays a consolidated, easy-to-read table in the bottom-right corner of the chart, clearly showing:
The Symbol and Quantity of your position.
Your Average Cost.
The current PnL in percentage (%) and base currency (e.g., USD, EUR).
Visibility Controls: Toggles in the settings allow you to show or hide the Average Cost line and the PnL summary box independently.
This tool is perfect for actively managing and visualizing your multi-asset portfolio positions without leaving your main trading chart. Simply enter your positions in the indicator's settings, and the script will automatically track the PnL for the symbol matching the current chart.
오픈 소스 스크립트
트레이딩뷰의 진정한 정신에 따라, 이 스크립트의 작성자는 이를 오픈소스로 공개하여 트레이더들이 기능을 검토하고 검증할 수 있도록 했습니다. 작성자에게 찬사를 보냅니다! 이 코드는 무료로 사용할 수 있지만, 코드를 재게시하는 경우 하우스 룰이 적용된다는 점을 기억하세요.
면책사항
해당 정보와 게시물은 금융, 투자, 트레이딩 또는 기타 유형의 조언이나 권장 사항으로 간주되지 않으며, 트레이딩뷰에서 제공하거나 보증하는 것이 아닙니다. 자세한 내용은 이용 약관을 참조하세요.
오픈 소스 스크립트
트레이딩뷰의 진정한 정신에 따라, 이 스크립트의 작성자는 이를 오픈소스로 공개하여 트레이더들이 기능을 검토하고 검증할 수 있도록 했습니다. 작성자에게 찬사를 보냅니다! 이 코드는 무료로 사용할 수 있지만, 코드를 재게시하는 경우 하우스 룰이 적용된다는 점을 기억하세요.
면책사항
해당 정보와 게시물은 금융, 투자, 트레이딩 또는 기타 유형의 조언이나 권장 사항으로 간주되지 않으며, 트레이딩뷰에서 제공하거나 보증하는 것이 아닙니다. 자세한 내용은 이용 약관을 참조하세요.