OPEN-SOURCE SCRIPT
SMS Indicator [Nicholas Merten]
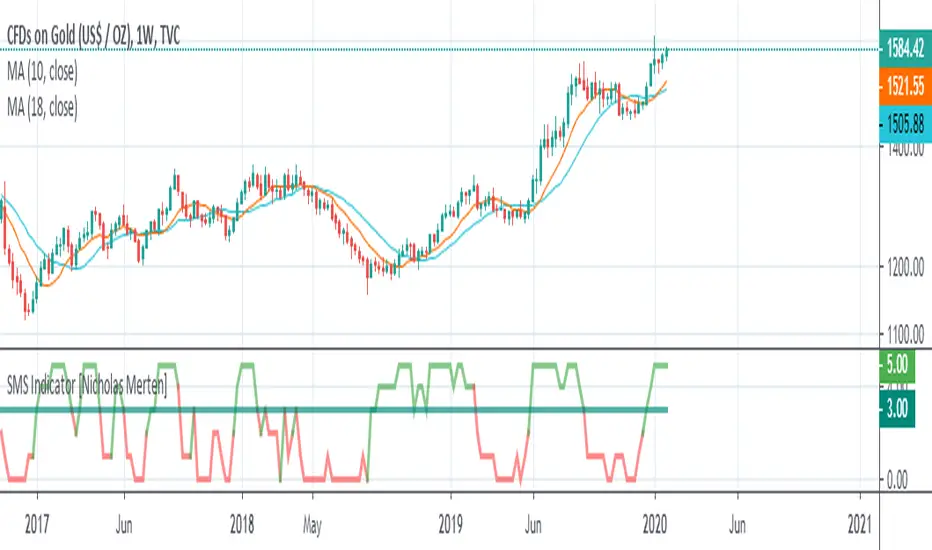
SMS is the acronym for the combination of the three prominent indicators; the squeeze momentum, MACD and Stochastic RSI indicator. It aggregates all of three lagging indicators to derive the trend of an underlying instrument. The script outcome works best when applied on weekly, standard charts (i.e. candles stick charts).
In general terms, these are the rules that define the indicator. But bear in mind, there are other miscellaneous factors that can determine the SMS indicator. (Feel free to review the pine code if you'd like):
"If the squeeze momentum is setting a higher weekly candle, add a point"
"If the MACD is closing its divergence from a descending movement, add a point"
"If the MACD crosses to the upside, add a point"
"If the blue line crosses the orange at the bottom of the Stochastic RSI , add one point"
"If the two lines have entered the purple channel from the bottom of the Stochastic RSI , add one point"
If the score is 3/5 or more, the indicator is flashing a bullish signal . If it's 2/5 or below, the indicator is flashing a bearish signal.
You can easily create an alert to trigger when there's a 3/5 point cross or a cross below 2/5, gearing up for a potential reversal in trend.
Finally, don't just trade on this indicator alone. This indicator is not meant to be used alone, rather, it can be a useful guide to understand the generic trend of an instrument by merging together a lot of leading indicators.
오픈 소스 스크립트
트레이딩뷰의 진정한 정신에 따라, 이 스크립트의 작성자는 이를 오픈소스로 공개하여 트레이더들이 기능을 검토하고 검증할 수 있도록 했습니다. 작성자에게 찬사를 보냅니다! 이 코드는 무료로 사용할 수 있지만, 코드를 재게시하는 경우 하우스 룰이 적용된다는 점을 기억하세요.
면책사항
해당 정보와 게시물은 금융, 투자, 트레이딩 또는 기타 유형의 조언이나 권장 사항으로 간주되지 않으며, 트레이딩뷰에서 제공하거나 보증하는 것이 아닙니다. 자세한 내용은 이용 약관을 참조하세요.
오픈 소스 스크립트
트레이딩뷰의 진정한 정신에 따라, 이 스크립트의 작성자는 이를 오픈소스로 공개하여 트레이더들이 기능을 검토하고 검증할 수 있도록 했습니다. 작성자에게 찬사를 보냅니다! 이 코드는 무료로 사용할 수 있지만, 코드를 재게시하는 경우 하우스 룰이 적용된다는 점을 기억하세요.
면책사항
해당 정보와 게시물은 금융, 투자, 트레이딩 또는 기타 유형의 조언이나 권장 사항으로 간주되지 않으며, 트레이딩뷰에서 제공하거나 보증하는 것이 아닙니다. 자세한 내용은 이용 약관을 참조하세요.