OPEN-SOURCE SCRIPT
업데이트됨 Fibonacci Warzone Boxes
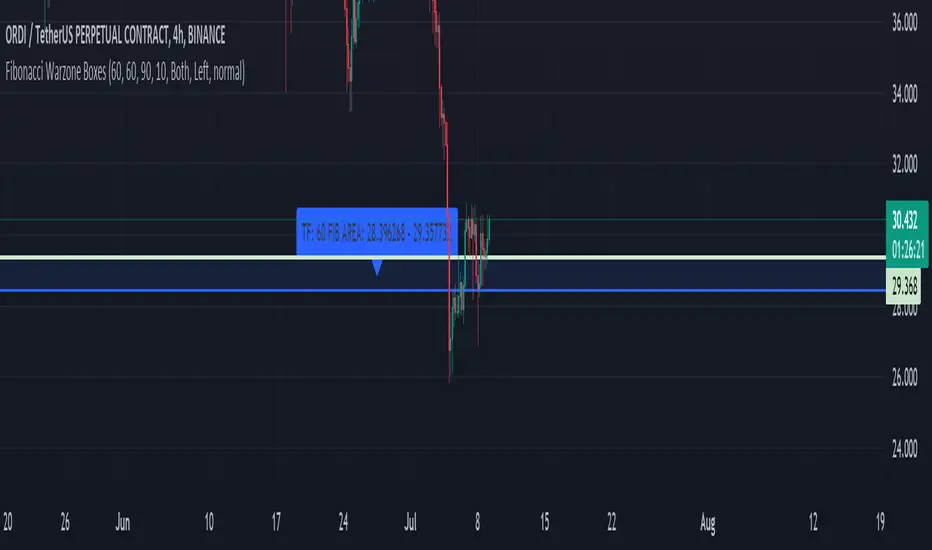
The "Fibonacci Warzone Boxes" is a unique trading indicator that leverages the power of Fibonacci retracement levels to identify critical support and resistance zones. Designed for both seasoned traders and novices, this tool dynamically calculates the 38.2% and 61.8% retracement levels from the highest and lowest prices within a user-defined lookback period and timeframe. By highlighting these zones, the indicator assists traders in making informed decisions about entry and exit points.
Unlike standard Fibonacci tools, the "Fibonacci Warzone Boxes" provides a visual representation of Fibonacci levels in the form of easy-to-interpret boxes, enhancing the decision-making process. This method helps traders quickly understand where significant price action can occur, improving their reaction time and strategic approach to the markets.
A. Key Features:
- Dynamic Fibonacci Levels: Automatically updates Fibonacci retracement levels based on the price action within the selected timeframe and lookback period.
- Customizable Settings: Users can easily adjust the timeframe, lookback period, and box transparency to suit their trading style and the specific characteristics of the asset they are trading.
- Visual Effectiveness: The indicator uses colored boxes (customizable in terms of color and transparency) to clearly denote the Fibonacci war zones, making it easy to spot key levels at a glance.
B. Usage:
To use this indicator, simply apply it to any chart and set the desired timeframe and lookback period. The indicator is particularly useful in markets with clear trends where Fibonacci levels can predict potential reversal points.
C. Benefits:
Enhanced Decision Making: Helps traders identify potential buy and sell zones based on historical price levels.
Adaptability: Works on any timeframe and with any market, making it a versatile tool for various trading strategies.
Ease of Use: Designed with a user-friendly interface, requiring minimal setup for optimal performance.
D. Guidelines for Use:
Ensure your chart is uncluttered to make the best use of this indicator.
Adjust the settings based on the volatility and characteristics of the market you are trading.
Combine this tool with other indicators for a comprehensive trading strategy, but avoid overcrowding the chart to maintain clarity.
릴리즈 노트
Adding possibility to change the color off the box릴리즈 노트
Adding labels containing timeframe and fib levels.Adding option to extend boxes
릴리즈 노트
Bug Fixing:- changing chart time frame should not impact the calculation
Improvements :
- possibility to change location of the label and text size
오픈 소스 스크립트
트레이딩뷰의 진정한 정신에 따라, 이 스크립트의 작성자는 이를 오픈소스로 공개하여 트레이더들이 기능을 검토하고 검증할 수 있도록 했습니다. 작성자에게 찬사를 보냅니다! 이 코드는 무료로 사용할 수 있지만, 코드를 재게시하는 경우 하우스 룰이 적용된다는 점을 기억하세요.
면책사항
해당 정보와 게시물은 금융, 투자, 트레이딩 또는 기타 유형의 조언이나 권장 사항으로 간주되지 않으며, 트레이딩뷰에서 제공하거나 보증하는 것이 아닙니다. 자세한 내용은 이용 약관을 참조하세요.
오픈 소스 스크립트
트레이딩뷰의 진정한 정신에 따라, 이 스크립트의 작성자는 이를 오픈소스로 공개하여 트레이더들이 기능을 검토하고 검증할 수 있도록 했습니다. 작성자에게 찬사를 보냅니다! 이 코드는 무료로 사용할 수 있지만, 코드를 재게시하는 경우 하우스 룰이 적용된다는 점을 기억하세요.
면책사항
해당 정보와 게시물은 금융, 투자, 트레이딩 또는 기타 유형의 조언이나 권장 사항으로 간주되지 않으며, 트레이딩뷰에서 제공하거나 보증하는 것이 아닙니다. 자세한 내용은 이용 약관을 참조하세요.