INVITE-ONLY SCRIPT
Seasonality by Luis Trompeter
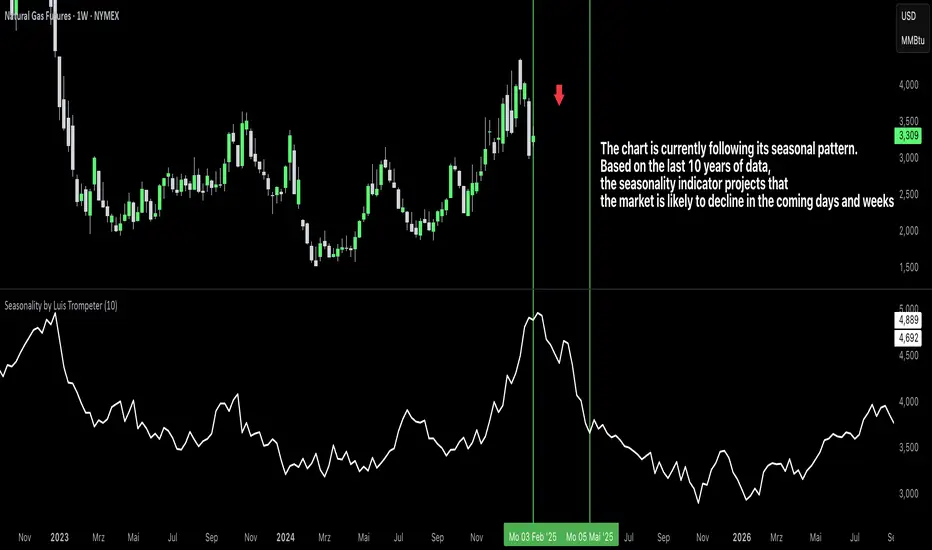
The Seasonality Indicator calculates the average historical performance of the currently selected asset by analyzing a user-defined number of past years (e.g., the last 10 years).
The number of years included in the calculation can be adjusted directly in the settings panel.
Based on this historical window, the indicator creates an average seasonal curve, which represents how the market typically behaved during each part of the year.
This averaged curve acts as a forecast for the upcoming months, highlighting periods where the market has shown a consistent tendency in the past.
Traders can use this seasonal projection to identify times of higher statistical likelihood for upward or downward movement.
The indicator works especially well when combined with the Seasonality Analysis Tool, which helps identify specific historical windows and strengthens overall seasonal decision-making.
Timeframe Requirement
This indicator must be used exclusively on the daily timeframe, as all calculations are based on daily candle data.
Other timeframes will not display accurate seasonal structures.
The Seasonality Indicator provides a clear, data-driven view of recurring annual patterns and allows traders to better understand when historical tendencies may influence future price action.
초대 전용 스크립트
이 스크립트는 작성자가 승인한 사용자만 접근할 수 있습니다. 사용하려면 요청 후 승인을 받아야 하며, 일반적으로 결제 후에 허가가 부여됩니다. 자세한 내용은 아래 작성자의 안내를 따르거나 luistrompeter에게 직접 문의하세요.
트레이딩뷰는 스크립트의 작동 방식을 충분히 이해하고 작성자를 완전히 신뢰하지 않는 이상, 해당 스크립트에 비용을 지불하거나 사용하는 것을 권장하지 않습니다. 커뮤니티 스크립트에서 무료 오픈소스 대안을 찾아보실 수도 있습니다.
작성자 지시 사항
This indicator can soon be accessed through the TradingView Paid Spaces system.
Purchasing through TradingView ensures secure payment processing, proper access management, and reliable availability for all users.
면책사항
해당 정보와 게시물은 금융, 투자, 트레이딩 또는 기타 유형의 조언이나 권장 사항으로 간주되지 않으며, 트레이딩뷰에서 제공하거나 보증하는 것이 아닙니다. 자세한 내용은 이용 약관을 참조하세요.