OPEN-SOURCE SCRIPT
업데이트됨 OSCAR Oscillator by GenZai - NNFX
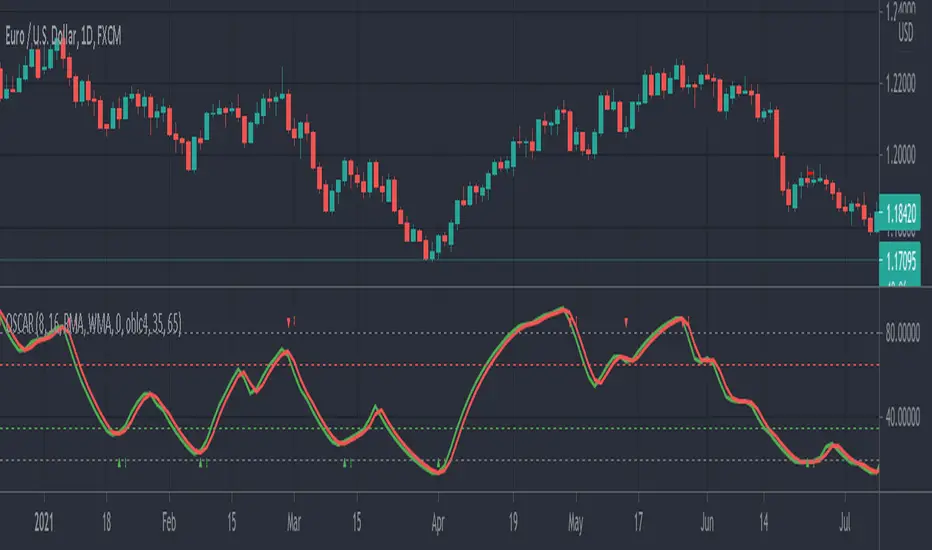
OSCAR Oscillator by GenZai
Green line is the Oscar Rough
Red line is the Oscar
By default based on the 8 last candles and smoothed using RMA
Purple line is the Slow Oscar
By default based on the 16 last candles and smoothed using WMA
HOW TO USE
Exit signaling
This indicator can be used as an exit indicator when line cross each other.
Entry signaling
When the green line crosses up, it indicates a long entry
When the red line crosses up, it indicates a short entry
Overbought/Oversold
When the indicator crosses the dashed grey lines it indicates Overbought Oversold
Slow Oscar Add-on
This is an Add-on to the orignal Oscar indicator
Can be hidden if you want the original experience of the Oscar indicator.
Can be used as a confirmation indicator by looking at the direction of the slope to verify is your are trending long or trending short.
Can be used as a baseline to confirm signals given by Oscar
Can be used to tweak your signals and test different settings.
Stock or Forex?
The program was originally written for stocks, but works equally well with the Forex market.
How this indicator is calculated ?
This is the formula we use to calculate the Oscar:
let A = the highest high of the last eight days (including today)
let B = the lowest low of the past eight days (including today)
let C = today's closing price
let X = yesterday's oscillator figure (Oscar)
Today's "rough" oscillator equals (C-B) divided by (A-B) times 100.
Next we "smooth" our rough number (let's call it Y) like this:
Final oscillator number = ((X divided by 3) times 2), plus (Y divided by 3).
SETTINGS:
You can choose between different smoothing options:
RMA: Moving average used in RSI. It is the Adjusted exponential moving averages (also known as Wilder's exponential moving average)
SMA : Simple moving average
EMA : Exponential moving average
WMA : Weighted moving average
릴리즈 노트
Hello,I'm Shipping version 2 as per requested by some of you.
The problem was it was not so easy to identify when the lines crossed.
So I've added a green arrow for long signals, and red arrows for short signals.
I've also added a Cross Signal Sensitivity input, so you can remove false signals when the lines barely cross each other.
You can see the crossing distances, being the 3rd number in Blue.
The Blue number is the difference between the value of the OscarRough (Green Line) and the Oscar (Red Line).
The default value is 0.
You can remove false signals with settings with a value of 0.5 or 1 for exemple.
릴리즈 노트
Minor v3Forgot to clean some code.
Nothing changed for the users.
릴리즈 노트
MAJOR RELEASE : V4ChangeList:
- The Slow Oscar is hidden by default
- Improved the signal Sensitivity
- Changed default setting of Signal Sensitivity to 0.5
- Added Signal lines (Dashed green and Dashed red)
- Possibility to add an indicator as a source
More on Improved Signal Sensitivity:
The old one was removing good signals just because the OscarRough (green line) barely crossed the Oscar (Red line).
Now if on the next candle the cross confirms (ie: OscarRough still over Oscar when crossed-over) you get a green confirmation arrow-up
More on Added Signal lines (Dashed green and Dashed red):
Again the point is to remove the amount of false signals, now if the crossover happens too low or too high (ie: over the Signal line for a long) you won't get the Green Triangle Signal to display.
More on Possibility to add an indicator as a source:
You can calculate the Oscar of the CMF, like in the exemple given. So you can get signals from your favorite other indicators.
By default the source is based on the close price of the candle.
릴리즈 노트
V5 Changelist2 more Smoothers have been added
- LSMA
- HMA
And Timeframe resolution settings has been added
릴리즈 노트
updated the chart screenshot but not the code오픈 소스 스크립트
트레이딩뷰의 진정한 정신에 따라, 이 스크립트의 작성자는 이를 오픈소스로 공개하여 트레이더들이 기능을 검토하고 검증할 수 있도록 했습니다. 작성자에게 찬사를 보냅니다! 이 코드는 무료로 사용할 수 있지만, 코드를 재게시하는 경우 하우스 룰이 적용된다는 점을 기억하세요.
면책사항
해당 정보와 게시물은 금융, 투자, 트레이딩 또는 기타 유형의 조언이나 권장 사항으로 간주되지 않으며, 트레이딩뷰에서 제공하거나 보증하는 것이 아닙니다. 자세한 내용은 이용 약관을 참조하세요.
오픈 소스 스크립트
트레이딩뷰의 진정한 정신에 따라, 이 스크립트의 작성자는 이를 오픈소스로 공개하여 트레이더들이 기능을 검토하고 검증할 수 있도록 했습니다. 작성자에게 찬사를 보냅니다! 이 코드는 무료로 사용할 수 있지만, 코드를 재게시하는 경우 하우스 룰이 적용된다는 점을 기억하세요.
면책사항
해당 정보와 게시물은 금융, 투자, 트레이딩 또는 기타 유형의 조언이나 권장 사항으로 간주되지 않으며, 트레이딩뷰에서 제공하거나 보증하는 것이 아닙니다. 자세한 내용은 이용 약관을 참조하세요.