OPEN-SOURCE SCRIPT
CM_Enhanced_Ichimoku Cloud-V5.2

New version of the improved Ichimoku cloud
Original by Chris Moody, great work.
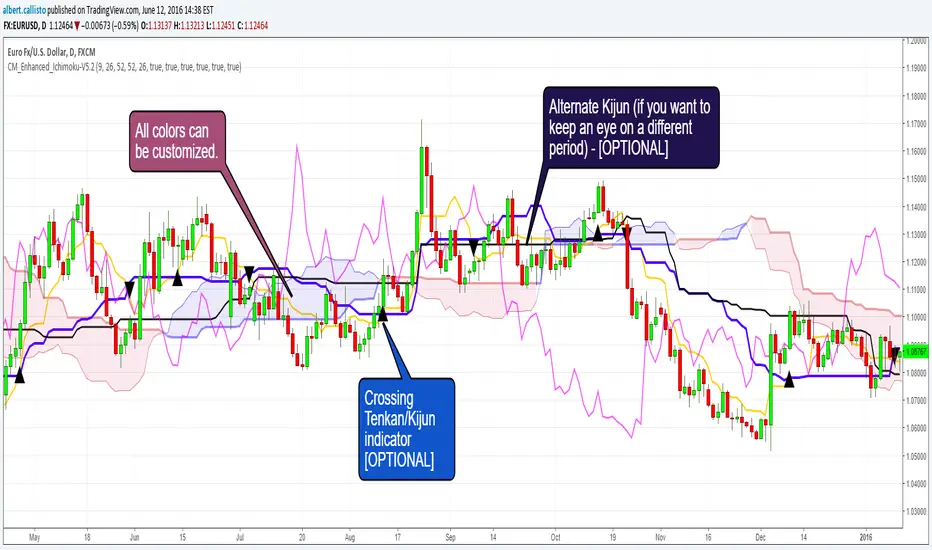
This indicator is a colorized Ichimoku with colors that you can change for any component. Not many changes between 5.1 and 5.2, I fixed some labels and the crossing detection, as well as the default colors.
There's not much more left we can do without radically changing the original Ichimoku. We could implement full-multiframe but you can already do that by adding several times this indicator and changing the periods.
Displayed components:
The script also provides indication of the crossings between Tenkan and Kijun, some trading strategies are based upon that. There is also a separate Kijun with its own period for those you'd like to have this information at another timeframe. I removed the third Kijun that was in version 5.1, I don't think it was widely used and made the configuration screen too crowded. If you really need this, take a look at Donchian indicators, the Kijun is basically a Donchian on 26 periods.
Chris Moody Version (v5):

Original by Chris Moody, great work.
This indicator is a colorized Ichimoku with colors that you can change for any component. Not many changes between 5.1 and 5.2, I fixed some labels and the crossing detection, as well as the default colors.
There's not much more left we can do without radically changing the original Ichimoku. We could implement full-multiframe but you can already do that by adding several times this indicator and changing the periods.
Displayed components:
- Kijun-Sen: middle of the highest/lowest prices during the last 26 periods
- Tenkan-Sen: middle of the highest/lowest prices during the last 9 periods
- Senkou Span A (SSA) : average of Kijun and Tenkan, projected 26 periods ahead
- Senkou Span B (SSB): middle of the highest/lowest prices during the last 52 periods, and projected 26 periods ahead
- Chikou Span: the closing price projected 26 periods behind.
- Kumo: the cloud itself, the area between SSA/SSB.
The script also provides indication of the crossings between Tenkan and Kijun, some trading strategies are based upon that. There is also a separate Kijun with its own period for those you'd like to have this information at another timeframe. I removed the third Kijun that was in version 5.1, I don't think it was widely used and made the configuration screen too crowded. If you really need this, take a look at Donchian indicators, the Kijun is basically a Donchian on 26 periods.
Chris Moody Version (v5):

오픈 소스 스크립트
트레이딩뷰의 진정한 정신에 따라, 이 스크립트의 작성자는 이를 오픈소스로 공개하여 트레이더들이 기능을 검토하고 검증할 수 있도록 했습니다. 작성자에게 찬사를 보냅니다! 이 코드는 무료로 사용할 수 있지만, 코드를 재게시하는 경우 하우스 룰이 적용된다는 점을 기억하세요.
면책사항
해당 정보와 게시물은 금융, 투자, 트레이딩 또는 기타 유형의 조언이나 권장 사항으로 간주되지 않으며, 트레이딩뷰에서 제공하거나 보증하는 것이 아닙니다. 자세한 내용은 이용 약관을 참조하세요.
오픈 소스 스크립트
트레이딩뷰의 진정한 정신에 따라, 이 스크립트의 작성자는 이를 오픈소스로 공개하여 트레이더들이 기능을 검토하고 검증할 수 있도록 했습니다. 작성자에게 찬사를 보냅니다! 이 코드는 무료로 사용할 수 있지만, 코드를 재게시하는 경우 하우스 룰이 적용된다는 점을 기억하세요.
면책사항
해당 정보와 게시물은 금융, 투자, 트레이딩 또는 기타 유형의 조언이나 권장 사항으로 간주되지 않으며, 트레이딩뷰에서 제공하거나 보증하는 것이 아닙니다. 자세한 내용은 이용 약관을 참조하세요.