INVITE-ONLY SCRIPT
Basma Tadawul KSA 2023
The Basma Tadawul indicator depends on the nature of history redrawing itself and on the recurrence of price movement
discovered by astronomical analysis
The indicator draws three columns that determine the beginning and end of the repetition of the movement forecast. We use the pattern clipping indicator to make a match between the current chart and the future forecast of the chart.
When the chart matches a specific percentage from the beginning of the pattern cut, it is confirmed that the imprint is real and we adopt the future forecast for the rest of the pattern
How to use Basma Tadawul System:
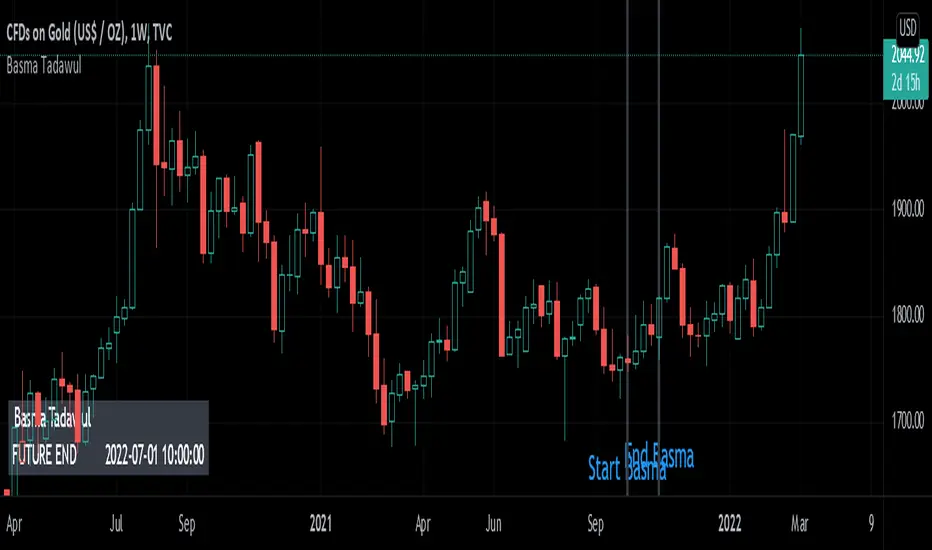
After placing the indicator on the chart, it will draw three virtical lines that show the beginning and end of the movement expected to be repeated
We use the tool to cut the pattern and draw it on the beginning and end of the forecast and then use it to predict the next price movement starting from the end of the previous movement
discovered by astronomical analysis
The indicator draws three columns that determine the beginning and end of the repetition of the movement forecast. We use the pattern clipping indicator to make a match between the current chart and the future forecast of the chart.
When the chart matches a specific percentage from the beginning of the pattern cut, it is confirmed that the imprint is real and we adopt the future forecast for the rest of the pattern
How to use Basma Tadawul System:
After placing the indicator on the chart, it will draw three virtical lines that show the beginning and end of the movement expected to be repeated
We use the tool to cut the pattern and draw it on the beginning and end of the forecast and then use it to predict the next price movement starting from the end of the previous movement
초대 전용 스크립트
이 스크립트는 작성자가 승인한 사용자만 접근할 수 있습니다. 사용하려면 요청 후 승인을 받아야 하며, 일반적으로 결제 후에 허가가 부여됩니다. 자세한 내용은 아래 작성자의 안내를 따르거나 Basmatadawul에게 직접 문의하세요.
트레이딩뷰는 스크립트의 작동 방식을 충분히 이해하고 작성자를 완전히 신뢰하지 않는 이상, 해당 스크립트에 비용을 지불하거나 사용하는 것을 권장하지 않습니다. 커뮤니티 스크립트에서 무료 오픈소스 대안을 찾아보실 수도 있습니다.
작성자 지시 사항
Telegram: https://t.me/+cHRLRD8CocU0ZDM0 Email:hajed1671@gmail.com
면책사항
해당 정보와 게시물은 금융, 투자, 트레이딩 또는 기타 유형의 조언이나 권장 사항으로 간주되지 않으며, 트레이딩뷰에서 제공하거나 보증하는 것이 아닙니다. 자세한 내용은 이용 약관을 참조하세요.