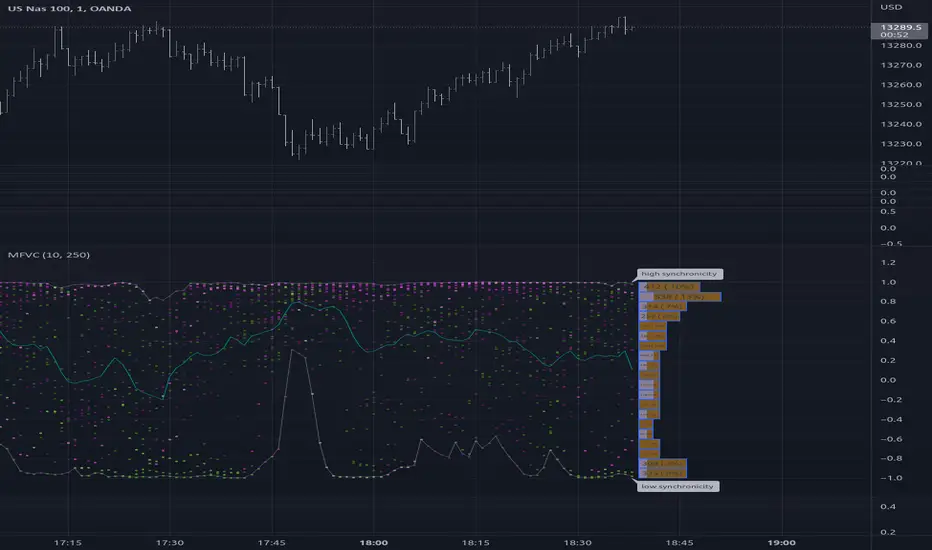
This is a complex indicator that looks to provide some insight into the correlation between volume and price volatility.
Rising volatility is depicted with the color green while falling volatility is depicted with purple.
Lightness of the color is used to depict the length of the window used, darker == shorter in the 2 -> 512 window range.
Rising volatility is depicted with the color green while falling volatility is depicted with purple.
Lightness of the color is used to depict the length of the window used, darker == shorter in the 2 -> 512 window range.
릴리즈 노트
added a histogram to show last and recent(10 bars) distribution of correlation릴리즈 노트
updated histogram calculation, it now allows the input length of the aggregation of values, added values display on histogram bars.릴리즈 노트
added labels with some description.오픈 소스 스크립트
트레이딩뷰의 진정한 정신에 따라, 이 스크립트의 작성자는 이를 오픈소스로 공개하여 트레이더들이 기능을 검토하고 검증할 수 있도록 했습니다. 작성자에게 찬사를 보냅니다! 이 코드는 무료로 사용할 수 있지만, 코드를 재게시하는 경우 하우스 룰이 적용된다는 점을 기억하세요.
면책사항
해당 정보와 게시물은 금융, 투자, 트레이딩 또는 기타 유형의 조언이나 권장 사항으로 간주되지 않으며, 트레이딩뷰에서 제공하거나 보증하는 것이 아닙니다. 자세한 내용은 이용 약관을 참조하세요.
오픈 소스 스크립트
트레이딩뷰의 진정한 정신에 따라, 이 스크립트의 작성자는 이를 오픈소스로 공개하여 트레이더들이 기능을 검토하고 검증할 수 있도록 했습니다. 작성자에게 찬사를 보냅니다! 이 코드는 무료로 사용할 수 있지만, 코드를 재게시하는 경우 하우스 룰이 적용된다는 점을 기억하세요.
면책사항
해당 정보와 게시물은 금융, 투자, 트레이딩 또는 기타 유형의 조언이나 권장 사항으로 간주되지 않으며, 트레이딩뷰에서 제공하거나 보증하는 것이 아닙니다. 자세한 내용은 이용 약관을 참조하세요.