OPEN-SOURCE SCRIPT
Variable Index Dynamic Average (VIDYA) with Histper
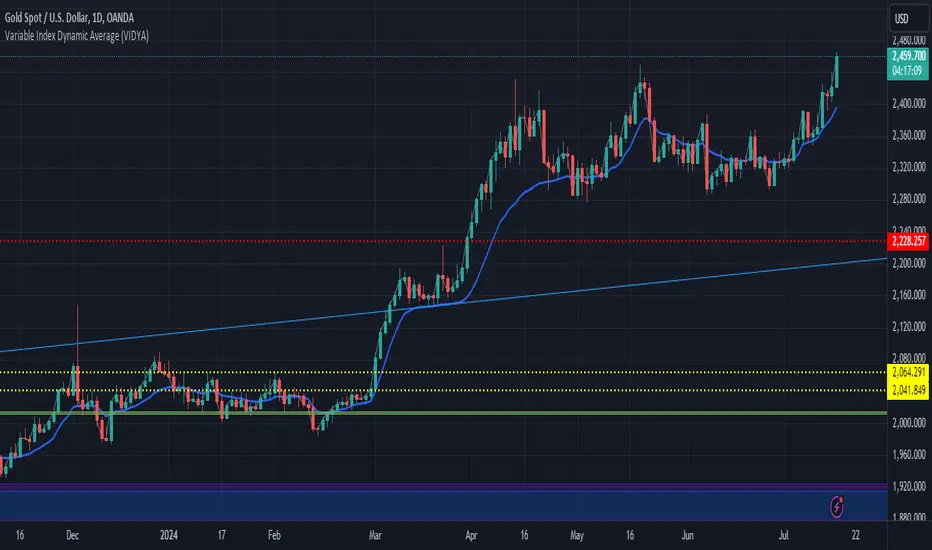
The Variable Index Dynamic Average (VIDYA) is a unique and adaptive moving average indicator designed to respond dynamically to market volatility. It adjusts its smoothing factor based on the standard deviation of price changes, making it more responsive during periods of high volatility and smoother during periods of low volatility. This version includes two key parameters:
Period: The number of bars used to calculate the VIDYA.
HistPer: The number of historical bars used to calculate the standard deviation, affecting the smoothness and responsiveness of the indicator.
Features:
Dynamic Adaptation: VIDYA adjusts its responsiveness based on market conditions, providing a balance between smoothness and responsiveness.
Customizable Parameters: Users can customize the Period and HistPer to fit their specific trading style and asset characteristics.
Overlay on Price Chart: The VIDYA is plotted directly on the price chart for easy visualization and integration with other technical analysis tools.
Usage:
Trend Identification: Use VIDYA to identify the prevailing trend. A rising VIDYA line indicates an uptrend, while a falling VIDYA line indicates a downtrend.
Entry and Exit Signals: Combine VIDYA with other indicators and trading strategies to confirm entry and exit signals.
Volatility Analysis: Adjust the HistPer to see how the indicator responds to different levels of market volatility.
오픈 소스 스크립트
트레이딩뷰의 진정한 정신에 따라, 이 스크립트의 작성자는 이를 오픈소스로 공개하여 트레이더들이 기능을 검토하고 검증할 수 있도록 했습니다. 작성자에게 찬사를 보냅니다! 이 코드는 무료로 사용할 수 있지만, 코드를 재게시하는 경우 하우스 룰이 적용된다는 점을 기억하세요.
면책사항
해당 정보와 게시물은 금융, 투자, 트레이딩 또는 기타 유형의 조언이나 권장 사항으로 간주되지 않으며, 트레이딩뷰에서 제공하거나 보증하는 것이 아닙니다. 자세한 내용은 이용 약관을 참조하세요.
오픈 소스 스크립트
트레이딩뷰의 진정한 정신에 따라, 이 스크립트의 작성자는 이를 오픈소스로 공개하여 트레이더들이 기능을 검토하고 검증할 수 있도록 했습니다. 작성자에게 찬사를 보냅니다! 이 코드는 무료로 사용할 수 있지만, 코드를 재게시하는 경우 하우스 룰이 적용된다는 점을 기억하세요.
면책사항
해당 정보와 게시물은 금융, 투자, 트레이딩 또는 기타 유형의 조언이나 권장 사항으로 간주되지 않으며, 트레이딩뷰에서 제공하거나 보증하는 것이 아닙니다. 자세한 내용은 이용 약관을 참조하세요.