OPEN-SOURCE SCRIPT
Triple RSI Multi-Timeframe
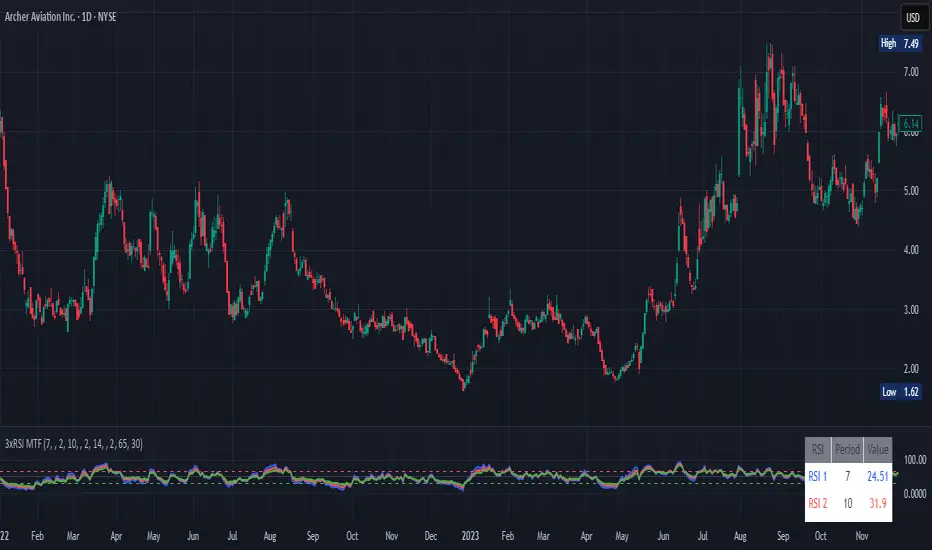
This indicator shows three RSI lines together so you can read market momentum on multiple timeframes at once. Each RSI has its own period, timeframe, and color, so you can quickly tell which line is fast, medium, or slow.
What it helps with
Spot overbought and oversold zones using the 70 and 30 levels, plus an optional midline at 50 for trend bias.
Align signals across timeframes: when two or three RSIs agree, the move is usually stronger.
Time entries and exits: use the shorter‑timeframe RSI for precise timing and the higher‑timeframe RSI for direction.
How to use
Choose the period and timeframe for RSI 1, 2, and 3 based on your style (e.g., 14 on current TF, 21 on 5m, 50 on 15m).
Pick distinct colors so you can recognize each line easily.
Turn on alerts to get notified when any RSI crosses into overbought or oversold.
오픈 소스 스크립트
진정한 트레이딩뷰 정신에 따라 이 스크립트 작성자는 트레이더가 기능을 검토하고 검증할 수 있도록 오픈소스로 공개했습니다. 작성자에게 찬사를 보냅니다! 무료로 사용할 수 있지만 코드를 다시 게시할 경우 하우스 룰이 적용된다는 점을 기억하세요.
면책사항
이 정보와 게시물은 TradingView에서 제공하거나 보증하는 금융, 투자, 거래 또는 기타 유형의 조언이나 권고 사항을 의미하거나 구성하지 않습니다. 자세한 내용은 이용 약관을 참고하세요.
오픈 소스 스크립트
진정한 트레이딩뷰 정신에 따라 이 스크립트 작성자는 트레이더가 기능을 검토하고 검증할 수 있도록 오픈소스로 공개했습니다. 작성자에게 찬사를 보냅니다! 무료로 사용할 수 있지만 코드를 다시 게시할 경우 하우스 룰이 적용된다는 점을 기억하세요.
면책사항
이 정보와 게시물은 TradingView에서 제공하거나 보증하는 금융, 투자, 거래 또는 기타 유형의 조언이나 권고 사항을 의미하거나 구성하지 않습니다. 자세한 내용은 이용 약관을 참고하세요.