PROTECTED SOURCE SCRIPT
업데이트됨 Ultimate RSI

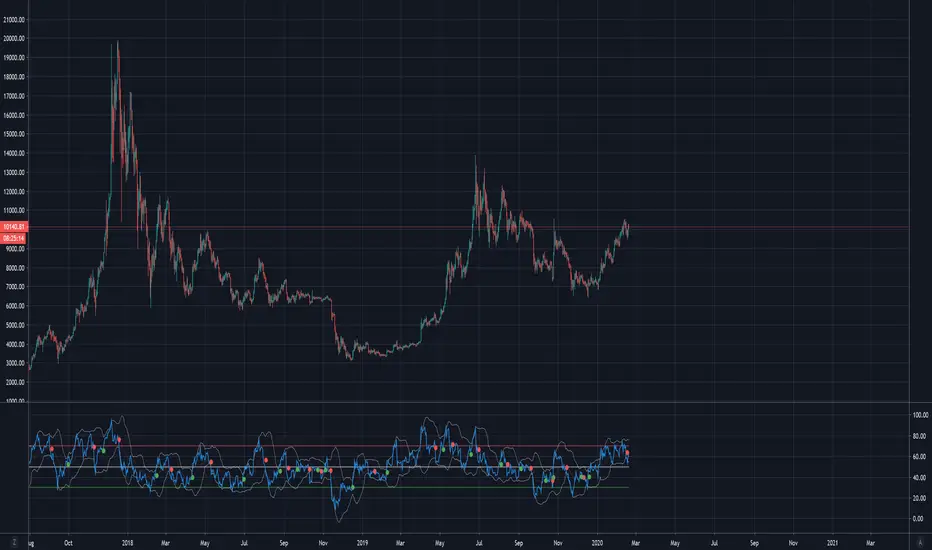
RSI w/BBands and 12 period moving average.
BBands show the standard deviation of the RSI, and can therefore suggest if a trend is oversold or overbought in conjunction with the 30 and 70 RSI values. A tightening of the BBands also suggests a major move/trend change is immanent.
The RSI moving average can suggest if the RSI is in a bullish or bearish trend . So if RSI>RSIMA then bullish trend , and if RSI<RSIMA then bearish trend . The RSIMA can also be used as another way to determine the true RSI values by eliminating noise and big sudden price movements (e.g. liquidation wicks). So for example if the RSIMA is at 70, then we know the asset is oversold etc
릴리즈 노트
Ultimate RSI w/BB+EMA's보호된 스크립트입니다
이 스크립트는 비공개 소스로 게시됩니다. 하지만 이를 자유롭게 제한 없이 사용할 수 있습니다 – 자세한 내용은 여기에서 확인하세요.
면책사항
해당 정보와 게시물은 금융, 투자, 트레이딩 또는 기타 유형의 조언이나 권장 사항으로 간주되지 않으며, 트레이딩뷰에서 제공하거나 보증하는 것이 아닙니다. 자세한 내용은 이용 약관을 참조하세요.
보호된 스크립트입니다
이 스크립트는 비공개 소스로 게시됩니다. 하지만 이를 자유롭게 제한 없이 사용할 수 있습니다 – 자세한 내용은 여기에서 확인하세요.
면책사항
해당 정보와 게시물은 금융, 투자, 트레이딩 또는 기타 유형의 조언이나 권장 사항으로 간주되지 않으며, 트레이딩뷰에서 제공하거나 보증하는 것이 아닙니다. 자세한 내용은 이용 약관을 참조하세요.