OPEN-SOURCE SCRIPT
TDI w/ Variety RSI, Averages, & Source Types [Loxx]
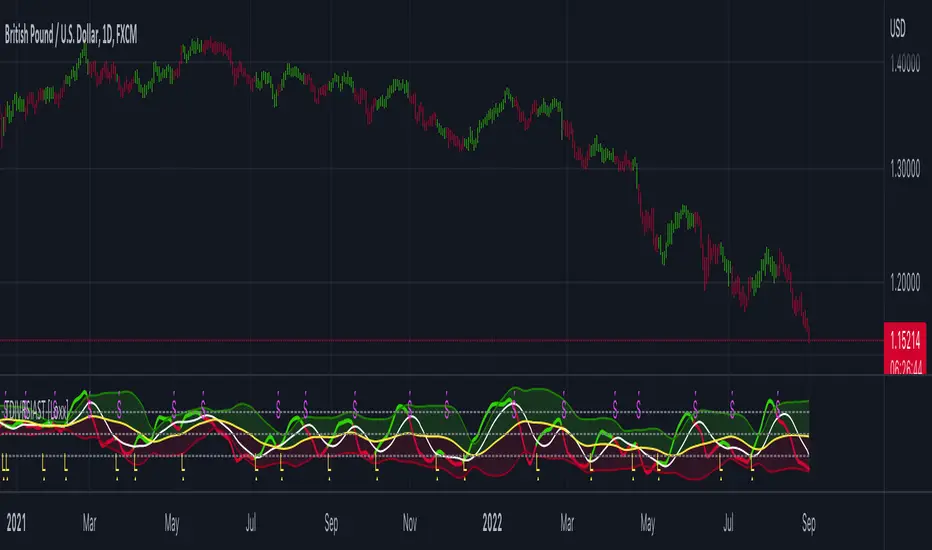
This hybrid indicator is developed to assist traders in their ability to decipher and monitor market conditions related to trend direction, market strength, and market volatility. Even though comprehensive, the Traders Dynamic Index (TDI) is easy to read and use. This version of TDI has 7 different types of RSI, 38 different types of Moving Averages, 33 source types, and 5 types of signals as well as alerts and coloring. Default RSI type is set to Jurik's RSX. This indicator can be used on any timeframe.
Green/Red line = RSI Price line
White line = Trade Signal line
Dark Green/Red lines = Volatility Band
Yellow line = Market Base Line
Gray dashed lines = Horizontal boundary lines, oversold/overbought
5 Signal Types w/ Alerts
Signal Crosses = Green/Red line crosses over or under White line
Floating Boundary Crosses = Green/Red line crosses over or under upper Dark Green/ lower Red lines
Horizontal Boundary Crosses = Green/Red line crosses over or under Gray dashed upper/lower lines
Floating Middle Crosses = Green/Red line crosses over or under Yellow line
Horizontal Middle Crosses = Green/Red line crosses over or under Gray dashed middle line
Manual Signal Types (no alerts included, this requires manual analysis)
Volatility Band Signals (Dark Green/Red lines) = When the Dark Green/Red lines are expanding, the market is strong and trending. When Dark Green/Red lines are constricting, the market is weak and in a range. When the Dark Green/Red lines are extremely tight in a narrow range, expect an economic announcement or other market condition to spike the market
Beyond these simple signal rules, there are various other signals or methods that can be used to derive long/short/exit signals from TDI included slope of the Green/Red line and bounces off the Yellow line.
Included
- Loxx's Expanded Source Types
- Loxx's Variety RSI
- Loxx's Moving Averages
- Signals
- Alerts
- Bar coloring
오픈 소스 스크립트
트레이딩뷰의 진정한 정신에 따라, 이 스크립트의 작성자는 이를 오픈소스로 공개하여 트레이더들이 기능을 검토하고 검증할 수 있도록 했습니다. 작성자에게 찬사를 보냅니다! 이 코드는 무료로 사용할 수 있지만, 코드를 재게시하는 경우 하우스 룰이 적용된다는 점을 기억하세요.
Public Telegram Group, t.me/algxtrading_public
VIP Membership Info: patreon.com/algxtrading/membership
VIP Membership Info: patreon.com/algxtrading/membership
면책사항
해당 정보와 게시물은 금융, 투자, 트레이딩 또는 기타 유형의 조언이나 권장 사항으로 간주되지 않으며, 트레이딩뷰에서 제공하거나 보증하는 것이 아닙니다. 자세한 내용은 이용 약관을 참조하세요.