OPEN-SOURCE SCRIPT
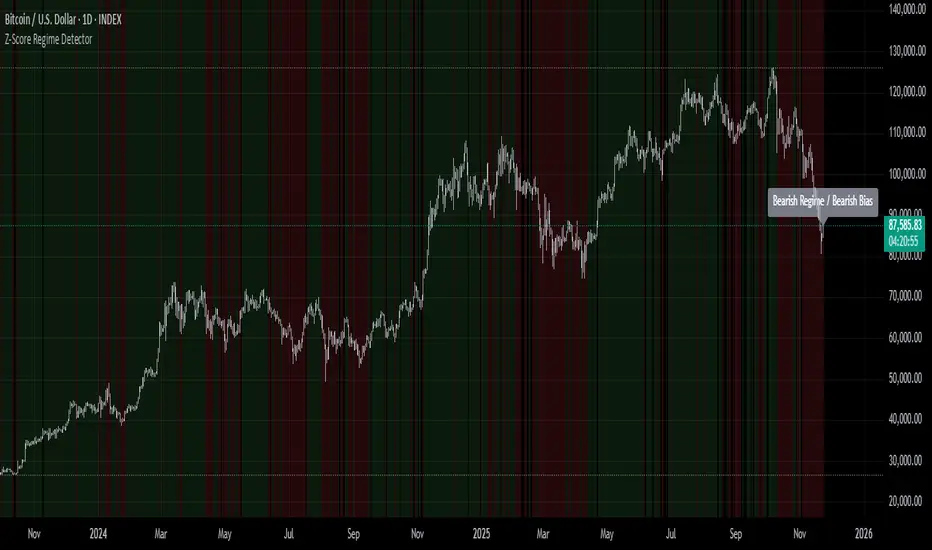
Z-Score Regime Detector

The Z-Score Regime Detector is a statistical market regime indicator that helps identify bullish and bearish market conditions based on normalized momentum of three core metrics:
- Price (Close)
- Volume
- Market Capitalization (via CRYPTOCAP:TOTAL)
Each metric is standardized using the Z-score over a user-defined period, allowing comparison of relative extremes across time. This removes raw value biases and reveals underlying momentum structure.
📊 How it Works
- Z-Score: Measures how far a current value deviates from its average in terms of standard deviations.
- A Bullish Regime is identified when both price and market cap Z-scores are above the volume Z-score.
- A Bearish Regime occurs when price and market cap Z-scores fall below volume Z-score.
Bias Signal:
- Bullish Bias = Price Z-score > Market Cap Z-score
- Bearish Bias = Market Cap Z-score > Price Z-score
This provides a statistically consistent framework to assess whether the market is flowing with strength or stress.
✅ Why This Might Be Effective
- Normalizing the data via Z-scores allows comparison of diverse metrics on a common scale.
- Using market cap offers broader insight than price alone, especially for crypto.
- Volume as a reference threshold helps identify accumulation/distribution regimes.
- Simple regime logic makes it suitable for trend confirmation, filtering, or position biasing in systems.
⚠️ Disclaimer
This script is for educational purposes only and should not be considered financial advice. Always perform your own research and risk management. Past performance is not indicative of future results. Use at your own discretion.
오픈 소스 스크립트
트레이딩뷰의 진정한 정신에 따라, 이 스크립트의 작성자는 이를 오픈소스로 공개하여 트레이더들이 기능을 검토하고 검증할 수 있도록 했습니다. 작성자에게 찬사를 보냅니다! 이 코드는 무료로 사용할 수 있지만, 코드를 재게시하는 경우 하우스 룰이 적용된다는 점을 기억하세요.
면책사항
해당 정보와 게시물은 금융, 투자, 트레이딩 또는 기타 유형의 조언이나 권장 사항으로 간주되지 않으며, 트레이딩뷰에서 제공하거나 보증하는 것이 아닙니다. 자세한 내용은 이용 약관을 참조하세요.
오픈 소스 스크립트
트레이딩뷰의 진정한 정신에 따라, 이 스크립트의 작성자는 이를 오픈소스로 공개하여 트레이더들이 기능을 검토하고 검증할 수 있도록 했습니다. 작성자에게 찬사를 보냅니다! 이 코드는 무료로 사용할 수 있지만, 코드를 재게시하는 경우 하우스 룰이 적용된다는 점을 기억하세요.
면책사항
해당 정보와 게시물은 금융, 투자, 트레이딩 또는 기타 유형의 조언이나 권장 사항으로 간주되지 않으며, 트레이딩뷰에서 제공하거나 보증하는 것이 아닙니다. 자세한 내용은 이용 약관을 참조하세요.