OPEN-SOURCE SCRIPT
업데이트됨 Cosmic Angle

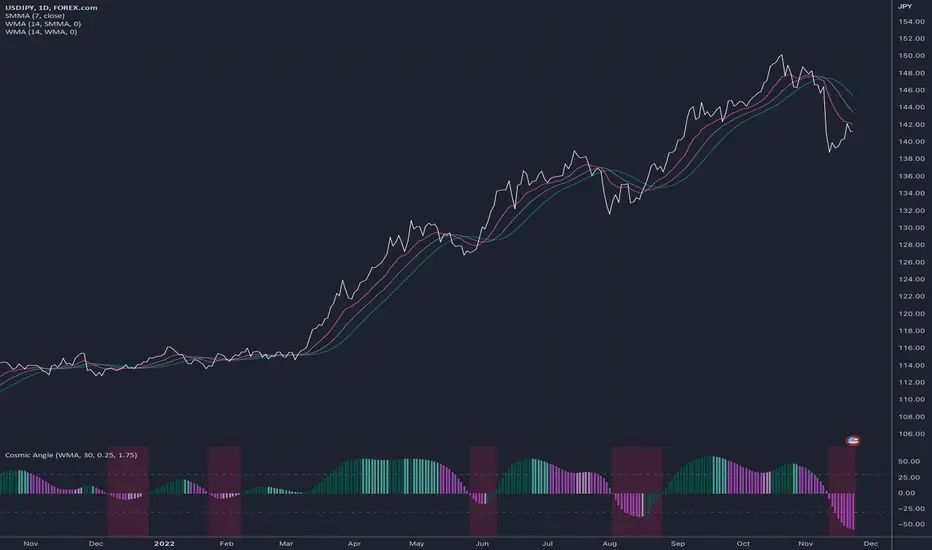
This is a histogram that can display a moving average's angle and also show how volatile the change in angle is.
To use:
(*1) This setting affects the bar colors. It represents the minimum difference in degrees between the n and n-1 bars' angle to force a change of color.
To use:
- Add any moving average indicator to the chart
- Click that indicator's More > Add Indicator on (MA)
- Select the Cosmic Angle indicator
- Adjust the Cosmic Angle's Price To Bar Ratio value to reflect that of your chart's
- Adjust the Cosmic Angle's Threshold as per your liking (*1)
(*1) This setting affects the bar colors. It represents the minimum difference in degrees between the n and n-1 bars' angle to force a change of color.
릴리즈 노트
UPDATES- Implemented Guides Position setting
- Updated example to use an extra "smoothing" moving average
NOTES
If your base moving average uses a short timeframe, the Cosmic Angle will likely look jagged and hard to read. An easy way to fix this problem is to add an extra moving average in between to smooth out the final output. In this example, a WMA with a short length of 9 is added onto the original SMMA and is then set as the source for the Cosmic Angle, producing a more relevant chart.
릴리즈 노트
- renamed get_degrees to get_slope
- updated slope calculation
- added bend plot
The bend shows when the slope itself is getting bigger or smaller. See the code for how to apply bend coloring to any moving average plot.
릴리즈 노트
Refactored the bend feature into a separate indicator called Cosmic Vector.릴리즈 노트
upgraded to version 5오픈 소스 스크립트
트레이딩뷰의 진정한 정신에 따라, 이 스크립트의 작성자는 이를 오픈소스로 공개하여 트레이더들이 기능을 검토하고 검증할 수 있도록 했습니다. 작성자에게 찬사를 보냅니다! 이 코드는 무료로 사용할 수 있지만, 코드를 재게시하는 경우 하우스 룰이 적용된다는 점을 기억하세요.
📣 Ask on Reddit: shorturl.at/BILRZ
👀 Watch on TikTok: shorturl.at/gzAPW
🚩 Disclaimer: the information created and published here is not prohibited, doesn't constitute investment advice, and isn't created solely for qualified investors
👀 Watch on TikTok: shorturl.at/gzAPW
🚩 Disclaimer: the information created and published here is not prohibited, doesn't constitute investment advice, and isn't created solely for qualified investors
면책사항
해당 정보와 게시물은 금융, 투자, 트레이딩 또는 기타 유형의 조언이나 권장 사항으로 간주되지 않으며, 트레이딩뷰에서 제공하거나 보증하는 것이 아닙니다. 자세한 내용은 이용 약관을 참조하세요.
오픈 소스 스크립트
트레이딩뷰의 진정한 정신에 따라, 이 스크립트의 작성자는 이를 오픈소스로 공개하여 트레이더들이 기능을 검토하고 검증할 수 있도록 했습니다. 작성자에게 찬사를 보냅니다! 이 코드는 무료로 사용할 수 있지만, 코드를 재게시하는 경우 하우스 룰이 적용된다는 점을 기억하세요.
📣 Ask on Reddit: shorturl.at/BILRZ
👀 Watch on TikTok: shorturl.at/gzAPW
🚩 Disclaimer: the information created and published here is not prohibited, doesn't constitute investment advice, and isn't created solely for qualified investors
👀 Watch on TikTok: shorturl.at/gzAPW
🚩 Disclaimer: the information created and published here is not prohibited, doesn't constitute investment advice, and isn't created solely for qualified investors
면책사항
해당 정보와 게시물은 금융, 투자, 트레이딩 또는 기타 유형의 조언이나 권장 사항으로 간주되지 않으며, 트레이딩뷰에서 제공하거나 보증하는 것이 아닙니다. 자세한 내용은 이용 약관을 참조하세요.