OPEN-SOURCE SCRIPT
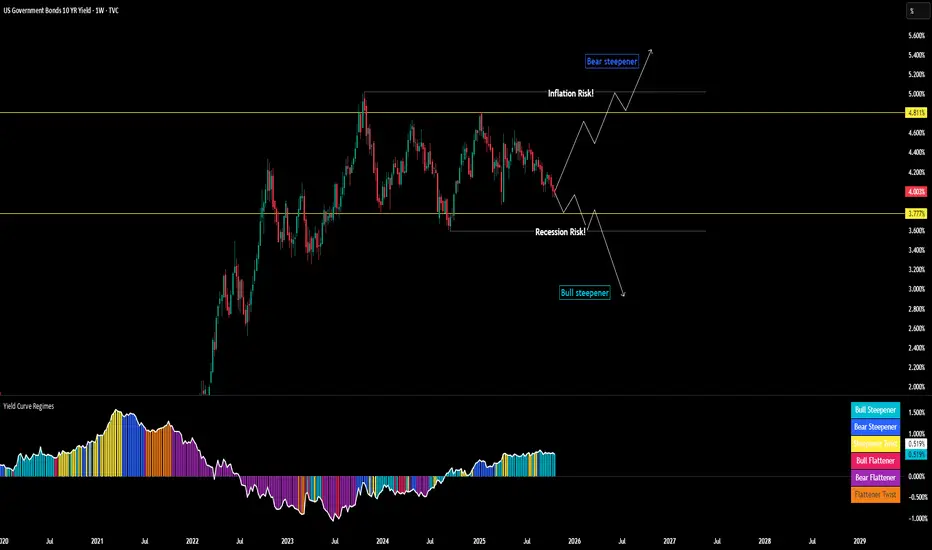
Yield Curve Regimes
Currently we are seeing equities and all other risk assets rallying to new all time high. But when will this stop?
There are multiple risks/signals i am monitoring to stay at the right side of the macro trade. Macro is everything: “When you get the Big-Picture wrong you wont live long.”
So lets go through a major risk that could be the catalyst for the next deeper correction
Capital needs to begin to move BACK across the risk curve as the yield curve steepens. We don't know if the source of the the crash will be from bear steepening or bull steepening because its unclear if long end rates blowing out will be the source of the crash.
If the Fed continues to make the policy error of being overly accommodative at this high level of nominal GDP + Inflation risk, the long end of the curve will price this.
Simple: If the Fed is to lose the long end can move up to price the inflation risk, which could ultimately pull risk assets down.
We have not seen this yet because the last inflation prints came in flat, but I expect these to come in higher over the next 6 months.
This means watching long end rates and their potential drag on equities will be critical. We are not seeing this yet as the Russell is sitting at all time highs and capital continues to move into low quality factors.
Look where the long end is moving + the attribution analysis for the move.
→ Down growth risk
→ Up Inflation risk
+ look what the 2s10s & the 10s30 are pricing and how these changes in the curve connect to the current yield curve regimes.
You can get the Trading view Skript 100% free here
오픈 소스 스크립트
트레이딩뷰의 진정한 정신에 따라, 이 스크립트의 작성자는 이를 오픈소스로 공개하여 트레이더들이 기능을 검토하고 검증할 수 있도록 했습니다. 작성자에게 찬사를 보냅니다! 이 코드는 무료로 사용할 수 있지만, 코드를 재게시하는 경우 하우스 룰이 적용된다는 점을 기억하세요.
면책사항
해당 정보와 게시물은 금융, 투자, 트레이딩 또는 기타 유형의 조언이나 권장 사항으로 간주되지 않으며, 트레이딩뷰에서 제공하거나 보증하는 것이 아닙니다. 자세한 내용은 이용 약관을 참조하세요.
오픈 소스 스크립트
트레이딩뷰의 진정한 정신에 따라, 이 스크립트의 작성자는 이를 오픈소스로 공개하여 트레이더들이 기능을 검토하고 검증할 수 있도록 했습니다. 작성자에게 찬사를 보냅니다! 이 코드는 무료로 사용할 수 있지만, 코드를 재게시하는 경우 하우스 룰이 적용된다는 점을 기억하세요.
면책사항
해당 정보와 게시물은 금융, 투자, 트레이딩 또는 기타 유형의 조언이나 권장 사항으로 간주되지 않으며, 트레이딩뷰에서 제공하거나 보증하는 것이 아닙니다. 자세한 내용은 이용 약관을 참조하세요.