INVITE-ONLY SCRIPT
업데이트됨 Black Hawk Trend 3
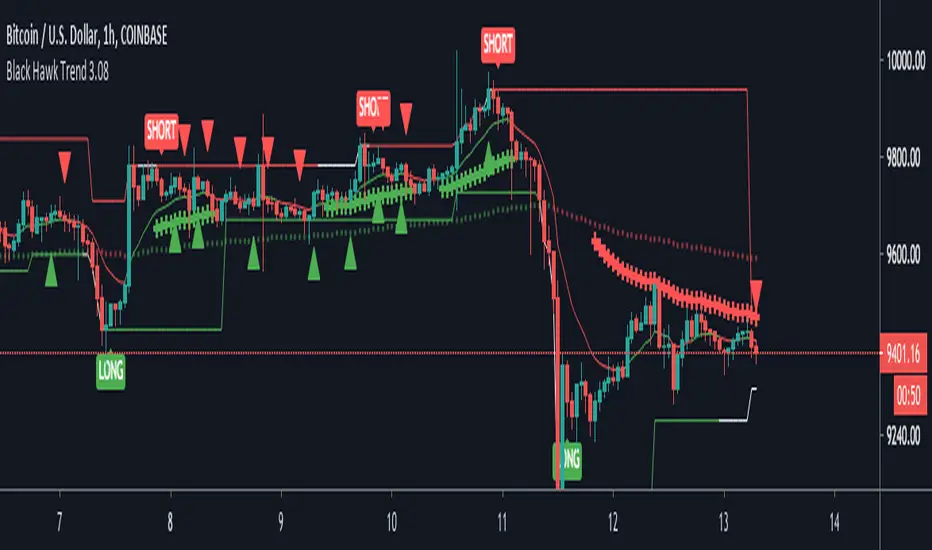
The Black Hawk Trend indicator uses data from sources (such as EMAs, RSI, Stochs) to derive a trend direction. This indicator contains a pivot line that turns green when there is a buy position (lower bar) and it turns red when there is an active sell position (upper bar).
When there is a buy/sell signal, this does not mean buy immediately at this point, but rather look for a potential entry.
This indicator has the ability to treat buy and sells separately (Default: 2 account method) or it can use them in tandem (1 account method).
There is a toggle in the settings to modify the code for Bitcoin vs Forex (& Stocks).
When there is a strong trend, a red/green “+” sign shows up; this typically means take caution when trying to take a position countertrend.
There are also red/green triangles that signify a potential area to add to a position.
#Disclaimer:
1. I am not a financial advisor.
2. I do not guarantee this script will provide consistent profits or that anyone can make money with it.
Use the link below to obtain access to this indicator.
릴리즈 노트
Updated pivots to readjust on big moves. 릴리즈 노트
Fixed chart for indicator릴리즈 노트
Added option for Aggressive Trading초대 전용 스크립트
이 스크립트는 작성자가 승인한 사용자만 접근할 수 있습니다. 사용하려면 요청 후 승인을 받아야 하며, 일반적으로 결제 후에 허가가 부여됩니다. 자세한 내용은 아래 작성자의 안내를 따르거나 accrypto1에게 직접 문의하세요.
트레이딩뷰는 스크립트의 작동 방식을 충분히 이해하고 작성자를 완전히 신뢰하지 않는 이상, 해당 스크립트에 비용을 지불하거나 사용하는 것을 권장하지 않습니다. 커뮤니티 스크립트에서 무료 오픈소스 대안을 찾아보실 수도 있습니다.
작성자 지시 사항
For access to indicators, email me at bhawktrader@gmail.com
면책사항
해당 정보와 게시물은 금융, 투자, 트레이딩 또는 기타 유형의 조언이나 권장 사항으로 간주되지 않으며, 트레이딩뷰에서 제공하거나 보증하는 것이 아닙니다. 자세한 내용은 이용 약관을 참조하세요.
초대 전용 스크립트
이 스크립트는 작성자가 승인한 사용자만 접근할 수 있습니다. 사용하려면 요청 후 승인을 받아야 하며, 일반적으로 결제 후에 허가가 부여됩니다. 자세한 내용은 아래 작성자의 안내를 따르거나 accrypto1에게 직접 문의하세요.
트레이딩뷰는 스크립트의 작동 방식을 충분히 이해하고 작성자를 완전히 신뢰하지 않는 이상, 해당 스크립트에 비용을 지불하거나 사용하는 것을 권장하지 않습니다. 커뮤니티 스크립트에서 무료 오픈소스 대안을 찾아보실 수도 있습니다.
작성자 지시 사항
For access to indicators, email me at bhawktrader@gmail.com
면책사항
해당 정보와 게시물은 금융, 투자, 트레이딩 또는 기타 유형의 조언이나 권장 사항으로 간주되지 않으며, 트레이딩뷰에서 제공하거나 보증하는 것이 아닙니다. 자세한 내용은 이용 약관을 참조하세요.