PROTECTED SOURCE SCRIPT
Volume Bubbles Delta Coloring Classic V1.0
OVERVIEW
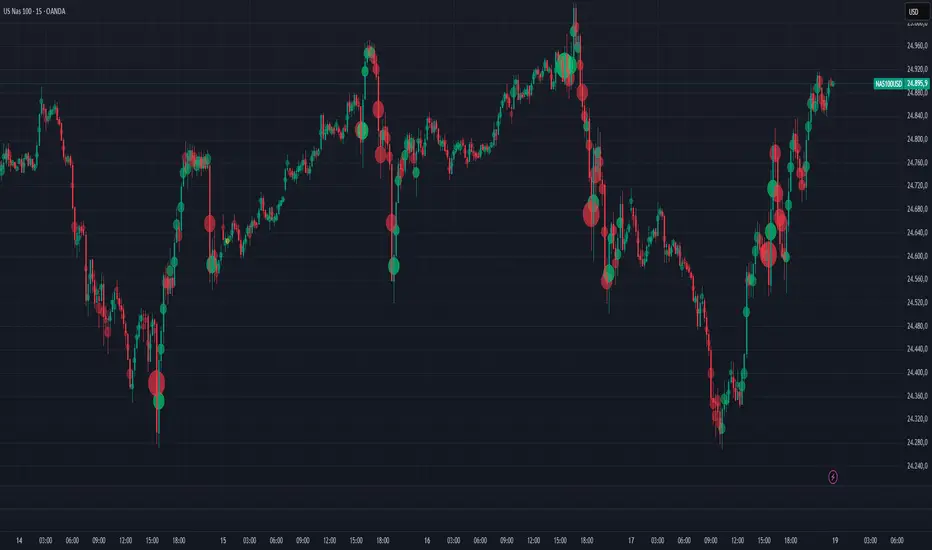
Bubbles Volume — Classic plots volume bubbles directly on the price chart. Bubble size scales with normalized volume, helping to visualize where trading activity concentrates. Optional heatmap coloring and significant-volume levels are included.
HOW IT WORKS
• Normalizes volume by its standard deviation to highlight unusually high participation.
• Draws circles ("bubbles") whose size corresponds to the normalized volume.
• Optional heatmap gradient emphasizes different volume regimes.
• Optional significant levels display labels or horizontal lines at the highest-volume bars.
INPUTS
• Bubbles / Threshold — Enable bubbles and set volume sensitivity.
• HeatMap — Enable gradient coloring by volume intensity.
• Significant Levels — Display labels or lines for the strongest volume bars.
• Levels Qty — Limit the number of labels or lines to display.
USE CASES
• Identify bars with unusually high trading activity.
• Spot reaction zones where large participants may have acted.
• Complement to price structure and trend analysis.
NOTES
• Uses chart volume only — not bid/ask orderflow.
• Visualization and educational tool, not a signal generator.
• Reduce visible bars if performance slows down.
CREDITS
Original concept by BigBeluga. Published under CC BY-NC-SA 4.0 license.
This is the unmodified, reference version.
보호된 스크립트입니다
이 스크립트는 비공개 소스로 게시됩니다. 하지만 이를 자유롭게 제한 없이 사용할 수 있습니다 – 자세한 내용은 여기에서 확인하세요.
면책사항
해당 정보와 게시물은 금융, 투자, 트레이딩 또는 기타 유형의 조언이나 권장 사항으로 간주되지 않으며, 트레이딩뷰에서 제공하거나 보증하는 것이 아닙니다. 자세한 내용은 이용 약관을 참조하세요.
보호된 스크립트입니다
이 스크립트는 비공개 소스로 게시됩니다. 하지만 이를 자유롭게 제한 없이 사용할 수 있습니다 – 자세한 내용은 여기에서 확인하세요.
면책사항
해당 정보와 게시물은 금융, 투자, 트레이딩 또는 기타 유형의 조언이나 권장 사항으로 간주되지 않으며, 트레이딩뷰에서 제공하거나 보증하는 것이 아닙니다. 자세한 내용은 이용 약관을 참조하세요.