INVITE-ONLY SCRIPT
Yearly Levels for Day Traders
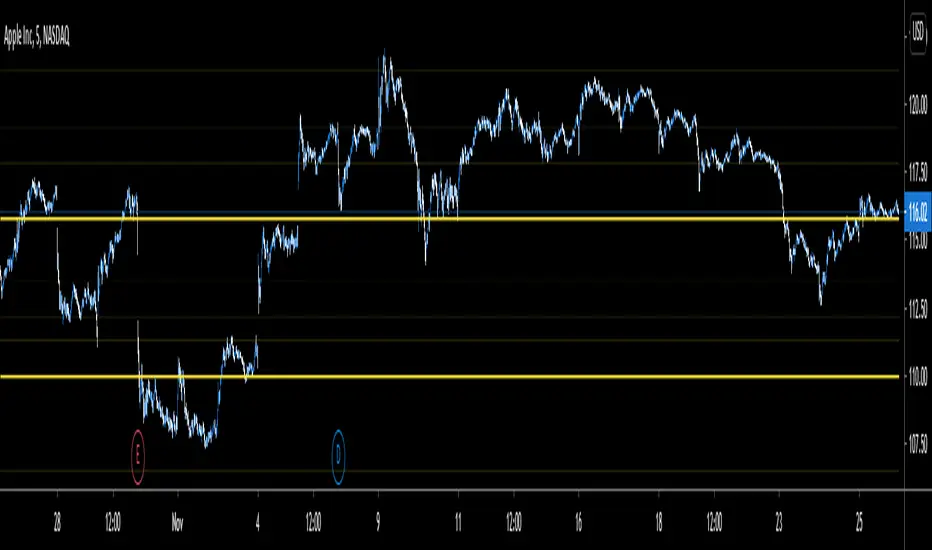
The above is the five minutes chart for  AAPL
AAPL
The script is useful in identifying price levels for the short term trading. The inputs are based on Fibonacci ratios but on yearly basis.
You will need to enter the pair ratio for where the stock is between ( I will show you).
Those pairs are as follows:
R1/R2
(0/0.23)
(.23/.38)
(.38/.61)
(.61/1)
(1/1.61)
(1.61/2.61)
(2.61/4.23)
(4.23/6.859)
(6.85/11.08)
(11.08/17.94)
(17.94/29.05)
(29.05/46.95)
(46.95/75.99)
(75.99/122.99)
I personally added the indicator multiple times to a template and put in all the pairs so I do not have to enter the pair each time.
The script does not tell you which level is a bottom or a top. Your experience matters.
If you are interested please PM me the username:
초대 전용 스크립트
이 스크립트는 작성자가 승인한 사용자만 접근할 수 있습니다. 사용하려면 요청 후 승인을 받아야 하며, 일반적으로 결제 후에 허가가 부여됩니다. 자세한 내용은 아래 작성자의 안내를 따르거나 malrawi에게 직접 문의하세요.
트레이딩뷰는 스크립트의 작동 방식을 충분히 이해하고 작성자를 완전히 신뢰하지 않는 이상, 해당 스크립트에 비용을 지불하거나 사용하는 것을 권장하지 않습니다. 커뮤니티 스크립트에서 무료 오픈소스 대안을 찾아보실 수도 있습니다.
작성자 지시 사항
면책사항
해당 정보와 게시물은 금융, 투자, 트레이딩 또는 기타 유형의 조언이나 권장 사항으로 간주되지 않으며, 트레이딩뷰에서 제공하거나 보증하는 것이 아닙니다. 자세한 내용은 이용 약관을 참조하세요.