OPEN-SOURCE SCRIPT
업데이트됨 Center of Candle Trendline
### **Center of Candle Trendline**
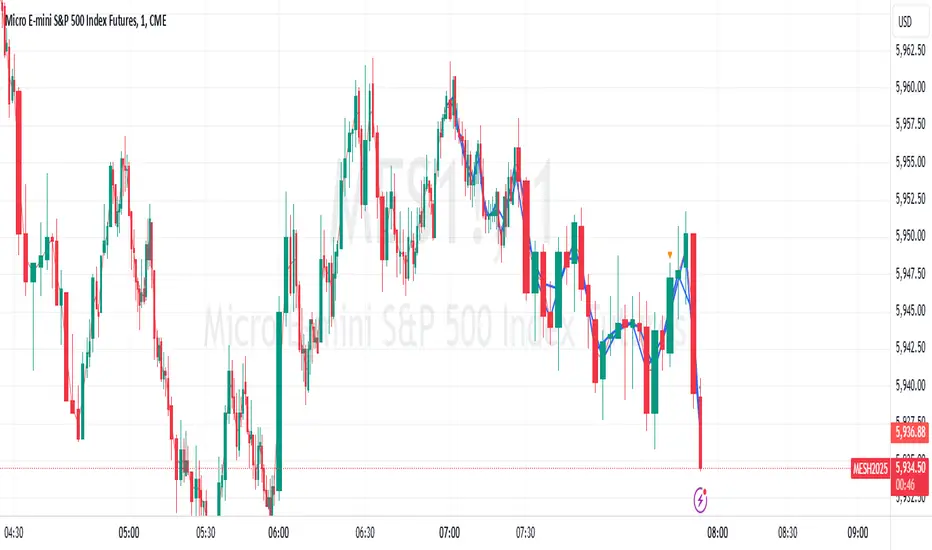
This script dynamically plots a trendline through the center of each candlestick's body. The "center" is calculated as the average of the open and close prices for each candle. The trendline updates in real-time as new candles form, providing a clean and straightforward way to track the market's midline movement.
#### **Features:**
1. **Dynamic Trendline:** The trendline connects the center points of consecutive candlestick bodies, giving a clear visual representation of price movements.
2. **Accurate Center Calculation:** The center is determined as `(open + close) / 2`, ensuring the trendline reflects the true midpoint of each candlestick body.
3. **Real-Time Updates:** The trendline updates automatically as new bars form, keeping your chart up to date with the latest price action.
4. **Customization-Ready:** Adjust the line’s color, width, or style easily to fit your chart preferences.
#### **How to Use:**
- Add this script to your chart to monitor the price movement relative to the center of candlestick bodies.
- Use the trendline to identify trends, reversals, or price consolidation zones.
#### **Applications:**
- **Trend Analysis:** Visualize how the market trends around the center of candlesticks.
- **Reversal Identification:** Detect potential reversal zones when the price deviates significantly from the trendline.
- **Support and Resistance Zones:** Use the trendline as a dynamic support or resistance reference.
This tool is perfect for traders who want a clean and minimalistic approach to tracking price action. Whether you're a beginner or an experienced trader, this script provides valuable insights without overwhelming your chart.
#### **Note:**
This is not a standalone trading strategy but a visual aid to complement your analysis. Always combine it with other tools and techniques for better trading decisions.
---
Feel free to tweak this description based on your preferences or style!
릴리즈 노트
removed extra blue line오픈 소스 스크립트
트레이딩뷰의 진정한 정신에 따라, 이 스크립트의 작성자는 이를 오픈소스로 공개하여 트레이더들이 기능을 검토하고 검증할 수 있도록 했습니다. 작성자에게 찬사를 보냅니다! 이 코드는 무료로 사용할 수 있지만, 코드를 재게시하는 경우 하우스 룰이 적용된다는 점을 기억하세요.
면책사항
해당 정보와 게시물은 금융, 투자, 트레이딩 또는 기타 유형의 조언이나 권장 사항으로 간주되지 않으며, 트레이딩뷰에서 제공하거나 보증하는 것이 아닙니다. 자세한 내용은 이용 약관을 참조하세요.
오픈 소스 스크립트
트레이딩뷰의 진정한 정신에 따라, 이 스크립트의 작성자는 이를 오픈소스로 공개하여 트레이더들이 기능을 검토하고 검증할 수 있도록 했습니다. 작성자에게 찬사를 보냅니다! 이 코드는 무료로 사용할 수 있지만, 코드를 재게시하는 경우 하우스 룰이 적용된다는 점을 기억하세요.
면책사항
해당 정보와 게시물은 금융, 투자, 트레이딩 또는 기타 유형의 조언이나 권장 사항으로 간주되지 않으며, 트레이딩뷰에서 제공하거나 보증하는 것이 아닙니다. 자세한 내용은 이용 약관을 참조하세요.