OPEN-SOURCE SCRIPT
Market Pressure Index [AlgoAlpha]
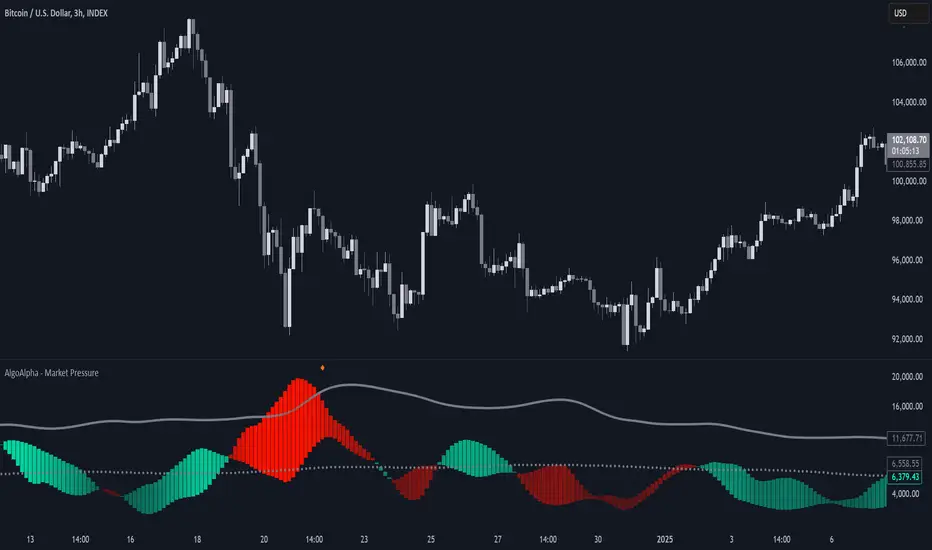
The Market Pressure Index is a cutting-edge trading tool designed to measure and visualize bullish and bearish momentum through a unique blend of volatility analysis and dynamic smoothing techniques. This indicator provides traders with an intuitive understanding of market pressure, making it easier to identify trend shifts, breakout opportunities, and key moments to take profit. Perfect for scalpers and swing traders looking for a strategic edge in volatile markets.
Key Features:
How to Use:
How It Works:
The Market Pressure Index separates bullish and bearish momentum by analyzing price movement (close vs. open) and volatility. These values are smoothed using Hull Moving Averages (HMA) to highlight trends while minimizing noise. A deviation-based upper band dynamically tracks market extremes, signaling breakout zones. Color gradients depict the intensity of momentum, offering a clear, visually intuitive representation of market pressure. Alerts are triggered when significant crossovers or take-profit conditions occur, giving traders actionable insights without constant chart monitoring.
Key Features:
- 🔎 Bullish and Bearish Volatility Separation: Dynamically calculates and displays bullish and bearish momentum separately, helping traders assess market direction with precision.
- 🎨 Customizable Appearance: Set your preferred colors for bullish and bearish signals to match your chart's theme.
- 📊 Deviation-Based Upper Band: Tracks extreme volatility levels using a configurable deviation multiplier, highlighting potential breakout points.
- 📈 Real-Time Signal Alerts: Provides alerts for bullish and bearish crossovers, as well as take-profit signals, ensuring you never miss key market movements.
- ⚡ Gradient-Based Visualization: Uses color gradients to depict the intensity of market pressure, making it easy to spot changes in momentum at a glance.
How to Use:
- Add the Indicator: Add the Market Pressure Index to your TradingView chart by clicking the star icon. Customize inputs like the pressure lookback period, deviation settings, and colors to fit your trading style.
- Interpret the Signals: Monitor the bullish and bearish momentum columns to gauge market direction. Look for crossovers to signal potential trend changes.
- Take Action: Use alerts for breakouts above the upper band or for take-profit levels to enhance your trade execution.
How It Works:
The Market Pressure Index separates bullish and bearish momentum by analyzing price movement (close vs. open) and volatility. These values are smoothed using Hull Moving Averages (HMA) to highlight trends while minimizing noise. A deviation-based upper band dynamically tracks market extremes, signaling breakout zones. Color gradients depict the intensity of momentum, offering a clear, visually intuitive representation of market pressure. Alerts are triggered when significant crossovers or take-profit conditions occur, giving traders actionable insights without constant chart monitoring.
오픈 소스 스크립트
트레이딩뷰의 진정한 정신에 따라, 이 스크립트의 작성자는 이를 오픈소스로 공개하여 트레이더들이 기능을 검토하고 검증할 수 있도록 했습니다. 작성자에게 찬사를 보냅니다! 이 코드는 무료로 사용할 수 있지만, 코드를 재게시하는 경우 하우스 룰이 적용된다는 점을 기억하세요.
🚨Get premium for 50% OFF (ends Jan 31st): algoalpha.io
🛜Get FREE signals: discord.gg/xCmqTVRexz
💡Tutorials: youtube.com/@AlgoAlpha
🛜Get FREE signals: discord.gg/xCmqTVRexz
💡Tutorials: youtube.com/@AlgoAlpha
면책사항
해당 정보와 게시물은 금융, 투자, 트레이딩 또는 기타 유형의 조언이나 권장 사항으로 간주되지 않으며, 트레이딩뷰에서 제공하거나 보증하는 것이 아닙니다. 자세한 내용은 이용 약관을 참조하세요.