OPEN-SOURCE SCRIPT
업데이트됨 ScalpTrader RSI

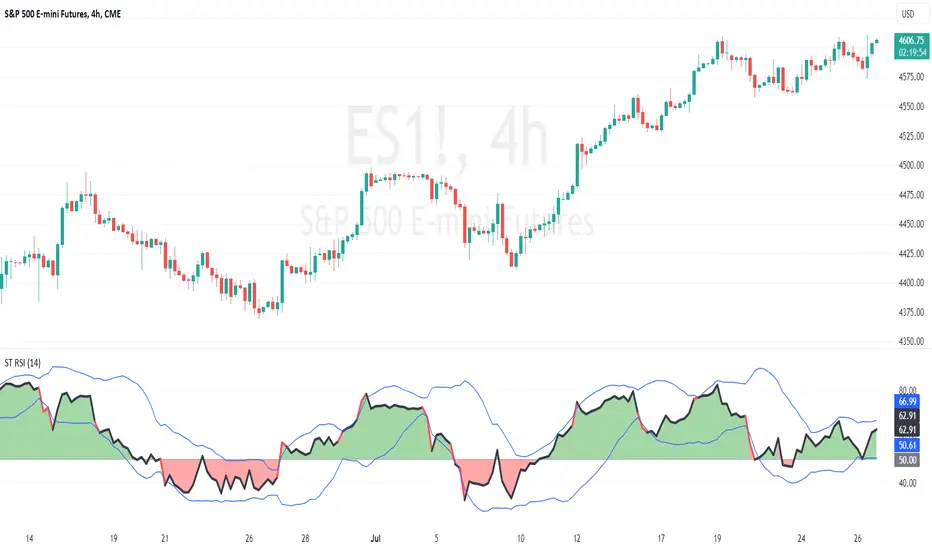
This script is a customized Relative Strength Index (RSI) indicator with added functionality, notably the optional Bollinger Bands overlay.
At its core, the script calculates the RSI, which is a popular momentum indicator used in technical analysis to identify overbought and oversold conditions. It does this by taking the average gain and the average loss over a user-defined period (default is 14) to compute the relative strength, which is then transformed into the RSI.
Furthermore, this script provides the option to overlay Bollinger Bands on the RSI line. Bollinger Bands, consisting of a middle band (a moving average) with two outer bands (standard deviations of the middle band), are used to measure volatility and 'relative' high or low prices. When applied to the RSI, they can offer another perspective on the momentum and volatility of the market.
RSI plot values are colored green if above 50 and red if below 50 to give the trader a sense of bullish or bearish price action.
I hope you find the indicator useful. Enjoy.
릴리즈 노트
Fix overlay setting릴리즈 노트
Update comment릴리즈 노트
Add highlight to RSI when above/below bands릴리즈 노트
Name update릴리즈 노트
Update license오픈 소스 스크립트
트레이딩뷰의 진정한 정신에 따라, 이 스크립트의 작성자는 이를 오픈소스로 공개하여 트레이더들이 기능을 검토하고 검증할 수 있도록 했습니다. 작성자에게 찬사를 보냅니다! 이 코드는 무료로 사용할 수 있지만, 코드를 재게시하는 경우 하우스 룰이 적용된다는 점을 기억하세요.
면책사항
해당 정보와 게시물은 금융, 투자, 트레이딩 또는 기타 유형의 조언이나 권장 사항으로 간주되지 않으며, 트레이딩뷰에서 제공하거나 보증하는 것이 아닙니다. 자세한 내용은 이용 약관을 참조하세요.
오픈 소스 스크립트
트레이딩뷰의 진정한 정신에 따라, 이 스크립트의 작성자는 이를 오픈소스로 공개하여 트레이더들이 기능을 검토하고 검증할 수 있도록 했습니다. 작성자에게 찬사를 보냅니다! 이 코드는 무료로 사용할 수 있지만, 코드를 재게시하는 경우 하우스 룰이 적용된다는 점을 기억하세요.
면책사항
해당 정보와 게시물은 금융, 투자, 트레이딩 또는 기타 유형의 조언이나 권장 사항으로 간주되지 않으며, 트레이딩뷰에서 제공하거나 보증하는 것이 아닙니다. 자세한 내용은 이용 약관을 참조하세요.