OPEN-SOURCE SCRIPT
Long Short dom
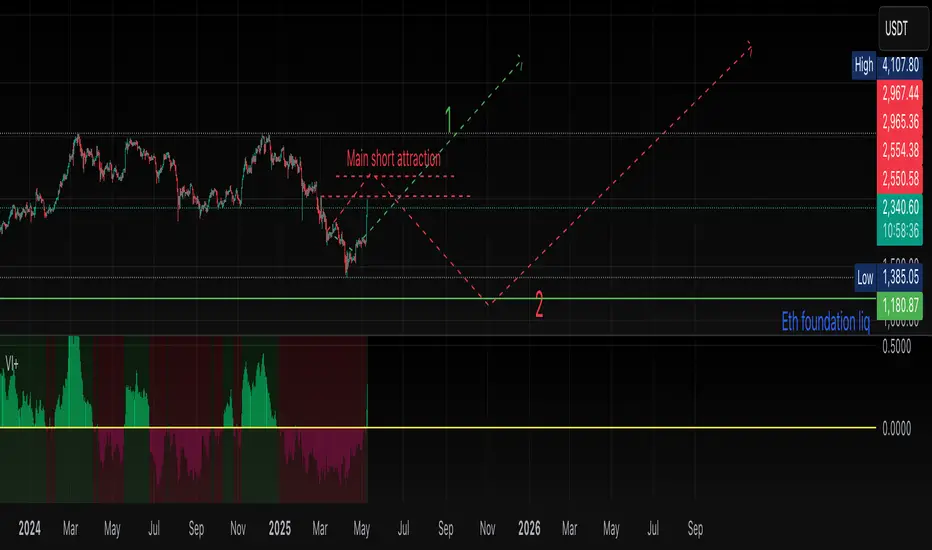
📊 Long Short dom (VI+) — Custom Vortex Trend Strength Indicator
This indicator is a refined version of the Vortex Indicator (VI) designed to help traders identify trend direction, momentum dominance, and potential long/short opportunities based on VI+ and VI– dynamics.
🔍 What It Shows:
• VI+ (Green Line): Measures upward trend strength.
• VI– (Red Line): Measures downward trend strength.
• Histogram (optional): Displays the difference between VI+ and VI–, helping visualize which side is dominant.
• Background Coloring: Highlights bullish or bearish dominance zones.
• Zero Line: A visual baseline to enhance clarity.
• Highest/Lowest Active Lines: Real-time markers for the strongest directional signals.
⸻
🛠️ Inputs:
• Length: Vortex calculation period (default 14).
• Show Histogram: Enable/disable VI+–VI– difference bars.
• Show Trend Background: Toggle colored zones showing trend dominance.
• Show Below Zero: Decide whether to display values that fall below 0 (for advanced use).
⸻
📈 Strategy Insights:
• When VI+ crosses above VI–, it indicates potential long momentum.
• When VI+ crosses below VI–, it signals possible short pressure.
• The delta histogram (VI+ – VI–) helps you quickly see shifts in momentum strength.
• The background shading provides an intuitive visual cue to assess trend dominance at a glance.
⸻
🚨 Built-in Alerts:
• Bullish Cross: VI+ crosses above VI– → possible entry long.
• Bearish Cross: VI+ crosses below VI– → possible entry short.
⸻
✅ Ideal For:
• Trend-following strategies
• Identifying long/short bias
• Confirming entries/exits with momentum analysis
⸻
This tool gives you clean, real-time visual insight into trend strength and shift dynamics, empowering smarter trade decisions with clarity and confidence.
오픈 소스 스크립트
트레이딩뷰의 진정한 정신에 따라, 이 스크립트의 작성자는 이를 오픈소스로 공개하여 트레이더들이 기능을 검토하고 검증할 수 있도록 했습니다. 작성자에게 찬사를 보냅니다! 이 코드는 무료로 사용할 수 있지만, 코드를 재게시하는 경우 하우스 룰이 적용된다는 점을 기억하세요.
면책사항
해당 정보와 게시물은 금융, 투자, 트레이딩 또는 기타 유형의 조언이나 권장 사항으로 간주되지 않으며, 트레이딩뷰에서 제공하거나 보증하는 것이 아닙니다. 자세한 내용은 이용 약관을 참조하세요.
오픈 소스 스크립트
트레이딩뷰의 진정한 정신에 따라, 이 스크립트의 작성자는 이를 오픈소스로 공개하여 트레이더들이 기능을 검토하고 검증할 수 있도록 했습니다. 작성자에게 찬사를 보냅니다! 이 코드는 무료로 사용할 수 있지만, 코드를 재게시하는 경우 하우스 룰이 적용된다는 점을 기억하세요.
면책사항
해당 정보와 게시물은 금융, 투자, 트레이딩 또는 기타 유형의 조언이나 권장 사항으로 간주되지 않으며, 트레이딩뷰에서 제공하거나 보증하는 것이 아닙니다. 자세한 내용은 이용 약관을 참조하세요.