OPEN-SOURCE SCRIPT
업데이트됨 Up Down Volatility
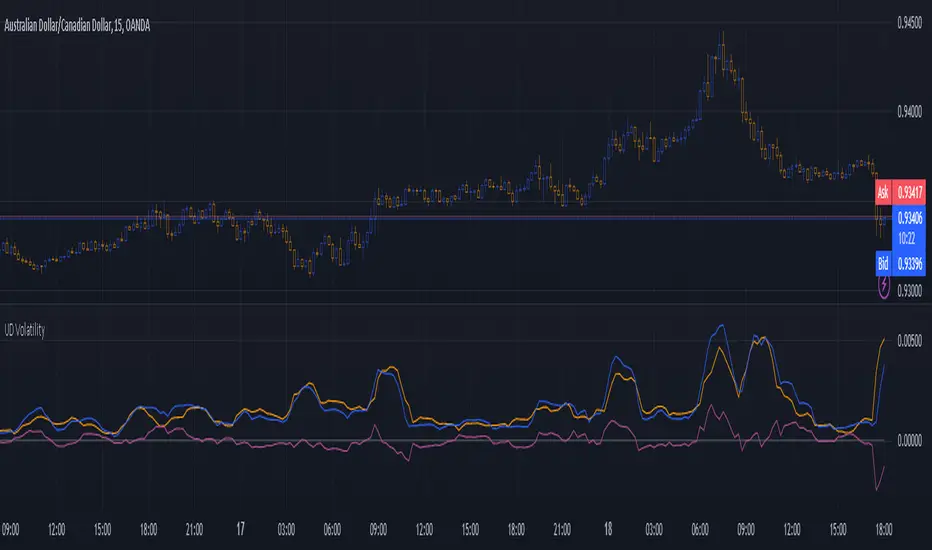
This is just experimental. I wanted the flexibility in looking at volatility and this indicator gives you several ways to do so.
I haven't figured out the best way to use this yet but I suspect that as a form of entry confirmation indicator would be best.
If you find a way this works well for you please drop me a note. It would nice know someone found a way to use it successfully!
The options available are:
* Your source can be price or the ATR.
* It allows you to separate the volatility of the bearish and bullish candles and even allows you to produce differential.
* You can choose to run the result through any one of many smoothers.
With the above options you can look at:
* The normal volatility. That is not split into bearish and bullish components.
* The bearish and bullish volatility and the difference between them.
* The relative bearish and bullish volatility and the difference between them.
The "The relative bearish and bullish" is each one divided into the source before it was split into Up and Down or low/high divided by close which should make the max value roughly around 1.
The code is structured to easily drop into a bigger system so use it as a lone indicator or add the code to some bigger project you are creating. If you do integrate it into something else then send me a note as it would be nice to know it's being well used.
Enjoy and good luck!
릴리즈 노트
Functionally the same. Just some labeling fixes.오픈 소스 스크립트
트레이딩뷰의 진정한 정신에 따라, 이 스크립트의 작성자는 이를 오픈소스로 공개하여 트레이더들이 기능을 검토하고 검증할 수 있도록 했습니다. 작성자에게 찬사를 보냅니다! 이 코드는 무료로 사용할 수 있지만, 코드를 재게시하는 경우 하우스 룰이 적용된다는 점을 기억하세요.
면책사항
해당 정보와 게시물은 금융, 투자, 트레이딩 또는 기타 유형의 조언이나 권장 사항으로 간주되지 않으며, 트레이딩뷰에서 제공하거나 보증하는 것이 아닙니다. 자세한 내용은 이용 약관을 참조하세요.
오픈 소스 스크립트
트레이딩뷰의 진정한 정신에 따라, 이 스크립트의 작성자는 이를 오픈소스로 공개하여 트레이더들이 기능을 검토하고 검증할 수 있도록 했습니다. 작성자에게 찬사를 보냅니다! 이 코드는 무료로 사용할 수 있지만, 코드를 재게시하는 경우 하우스 룰이 적용된다는 점을 기억하세요.
면책사항
해당 정보와 게시물은 금융, 투자, 트레이딩 또는 기타 유형의 조언이나 권장 사항으로 간주되지 않으며, 트레이딩뷰에서 제공하거나 보증하는 것이 아닙니다. 자세한 내용은 이용 약관을 참조하세요.