OPEN-SOURCE SCRIPT
Fed Net Liquidity
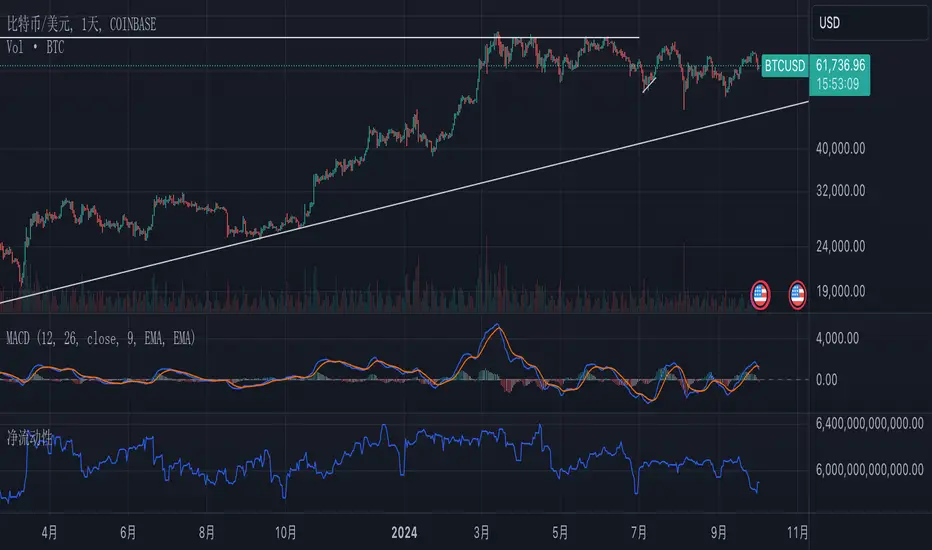
Net Liquidity = Federal Reserve Total Assets - Treasury General Account (TGA) - Reverse Repurchase Agreements (RRP) Balance
1. Federal Reserve Total Assets: This is the sum of everything the Fed owns, like government bonds and mortgage-backed securities. You can snag this data from the Fed’s weekly balance sheet report.
2. Treasury General Account (TGA): Think of this as the U.S. government’s checking account at the Fed. When the TGA balance goes up, it means the government is pulling liquidity out of the market, and vice versa.
3. Reverse Repurchase Agreements (RRP) Balance: This represents the liquidity the Fed absorbs from the market through reverse repo operations. When financial institutions park money in the Fed’s RRP account, there’s less cash available in the market.
Why Use Net Liquidity?
Net liquidity is seen as a key indicator of the actual amount of money available in the market. It helps gauge the overall liquidity conditions that can influence financial markets.
Where to Find the Data:
1. Federal Reserve Total Assets: You can find this in the Fed’s weekly balance sheet (the H.4.1 report). Here’s the link: Federal Reserve Statistical Release - H.4.1.
Steps to Calculate Net Liquidity Yourself:
1. Get the Fed’s Total Assets: Look up the latest H.4.1 report and jot down the total assets figure.
2. Find the TGA Balance: Head over to the U.S. Treasury’s Daily Treasury Statement to locate the “Treasury General Account” balance.
3. Get the RRP Balance: You can find this number in the H.4.1 report or on the New York Fed’s website under “Reverse Repurchase Agreements.”
4. Do the Math: Simply subtract the TGA and RRP balances from the Fed’s total assets—that gives you the net liquidity.
오픈 소스 스크립트
트레이딩뷰의 진정한 정신에 따라, 이 스크립트의 작성자는 이를 오픈소스로 공개하여 트레이더들이 기능을 검토하고 검증할 수 있도록 했습니다. 작성자에게 찬사를 보냅니다! 이 코드는 무료로 사용할 수 있지만, 코드를 재게시하는 경우 하우스 룰이 적용된다는 점을 기억하세요.
면책사항
해당 정보와 게시물은 금융, 투자, 트레이딩 또는 기타 유형의 조언이나 권장 사항으로 간주되지 않으며, 트레이딩뷰에서 제공하거나 보증하는 것이 아닙니다. 자세한 내용은 이용 약관을 참조하세요.
오픈 소스 스크립트
트레이딩뷰의 진정한 정신에 따라, 이 스크립트의 작성자는 이를 오픈소스로 공개하여 트레이더들이 기능을 검토하고 검증할 수 있도록 했습니다. 작성자에게 찬사를 보냅니다! 이 코드는 무료로 사용할 수 있지만, 코드를 재게시하는 경우 하우스 룰이 적용된다는 점을 기억하세요.
면책사항
해당 정보와 게시물은 금융, 투자, 트레이딩 또는 기타 유형의 조언이나 권장 사항으로 간주되지 않으며, 트레이딩뷰에서 제공하거나 보증하는 것이 아닙니다. 자세한 내용은 이용 약관을 참조하세요.