OPEN-SOURCE SCRIPT
업데이트됨 L1 Multidimensional KDJ
Level: 1
Background
The KDJ oscillator display consists of 3 lines (K, D and J - hence the name of the display) and 2 levels. K and D are the same lines you see when using the stochastic oscillator. The J line in turn represents the deviation of the D value from the K value. The convergence of these lines indicates new trading opportunities. Just like the Stochastic Oscillator, oversold and overbought levels correspond to the times when the trend is likely to reverse.
Function
L1 Multidimensional KDJ utilizes multiple KDJ modeling across multiple time frames. In this instance, it covers three time frames as day, week and month. Although it is named like that, one can deduce and use it in small time frames e.g. 15mins (day), 60mins (week) and 4H (month) because KDJ oscillator is commonly used for small time frames across various markets.
Key Signal
kd --> day K value
kw --> week K value
km --> month K value
dd --> day D value
dw --> week D value
dm --> month D value
divergence --> divergence among day, week, month D values
resonance --> all three time frame D values are in the same direction
Pros and Cons
Pros:
1. Enable multidimensional KDJ,especially D value comparisons
2. divergence and resoanance among different time frame KDJ can be disclosed
Cons:
1. It may satruate for extreme conditions of long and short.
2. Not accurate for long and short entries by resonance effect.
Remarks
Bring about multiple time frames into consideration of KDJ is novel.
Readme
In real life, I am a prolific inventor. I have successfully applied for more than 60 international and regional patents in the past 12 years. But in the past two years or so, I have tried to transfer my creativity to the development of trading strategies. Tradingview is the ideal platform for me. I am selecting and contributing some of the hundreds of scripts to publish in Tradingview community. Welcome everyone to interact with me to discuss these interesting pine scripts.
The scripts posted are categorized into 5 levels according to my efforts or manhours put into these works.
Level 1 : interesting script snippets or distinctive improvement from classic indicators or strategy. Level 1 scripts can usually appear in more complex indicators as a function module or element.
Level 2 : composite indicator/strategy. By selecting or combining several independent or dependent functions or sub indicators in proper way, the composite script exhibits a resonance phenomenon which can filter out noise or fake trading signal to enhance trading confidence level.
Level 3 : comprehensive indicator/strategy. They are simple trading systems based on my strategies. They are commonly containing several or all of entry signal, close signal, stop loss, take profit, re-entry, risk management, and position sizing techniques. Even some interesting fundamental and mass psychological aspects are incorporated.
Level 4 : script snippets or functions that do not disclose source code. Interesting element that can reveal market laws and work as raw material for indicators and strategies. If you find Level 1~2 scripts are helpful, Level 4 is a private version that took me far more efforts to develop.
Level 5 : indicator/strategy that do not disclose source code. private version of Level 3 script with my accumulated script processing skills or a large number of custom functions. I had a private function library built in past two years. Level 5 scripts use many of them to achieve private trading strategy.
릴리즈 노트
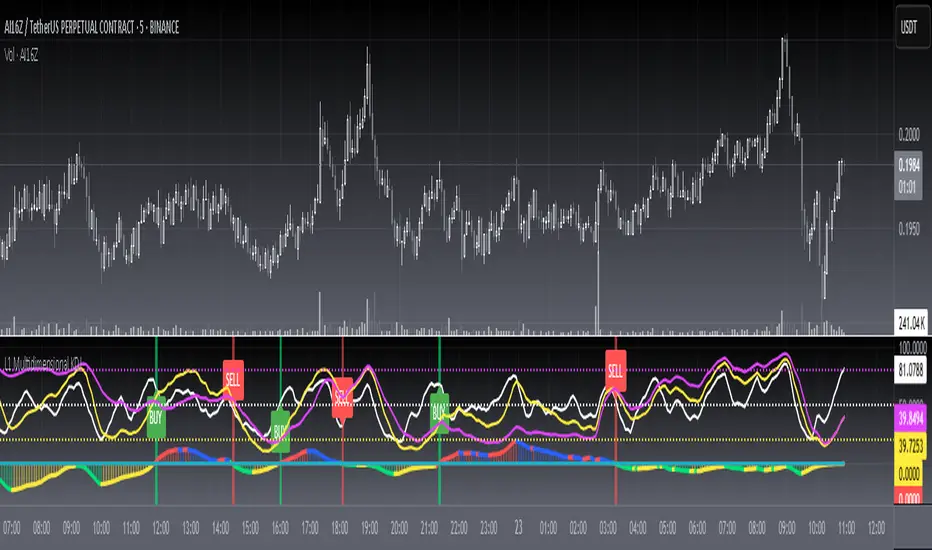
OVERVIEW This indicator analyzes price momentum using multidimensional KDJ oscillator values calculated over daily, weekly, and monthly timeframes. Generates actionable trading signals based on dynamic cross relationships between weekly/monthly D-line interactions while incorporating advanced analytical layers such as divergence detection and resonance patterns.
FEATURES
Multi-Timeframe Analysis:
Daily KDJ computed using 5-period parameters
Weekly KDJ based on 27-period settings
Monthly configuration employing 89-period metrics
Actionable Signals:
• Buy signal triggered by weekly/monthly D-line bullish crossover
• Sell signal activated during bearish crossover events
• Visualized with distinct colored labels
Visual Indicators:
✓ Threshold lines (user adjustable) displayed as dotted references
✓ Dynamic differential bars showing weekly/monthly D disparity
✓ Background highlighting confirming trade triggers
Advanced Analytics:
▪ Divergence monitoring identifying conflicting trend directions
▫ Three-period共振(resonance) confirmation requiring sustained upward alignment
■ Last valid value tracking prevents stale data usage
HOW TO USE
Adjust threshold levels using input controls:
botinput = Lower Boundary Setting (default 20)
topinput = Upper Boundary Setting (default 80)
midinput = Midpoint Reference (fixed at 50)
Interpret plot displays:
White line: Daily D momentum
Yellow/Fuchsia lines: Weekly/Monthly D comparisons
Color-coded columns show directional disparities
Monitor pattern formations:
⏷ Bull/Bear flags appear precisely on confirmed crossovers
⇆ Divergence alerts (red signals) indicate potential reversal zones
LIMITATIONS
Historical data requirements may cause delays in initial calculations
Momentum oscillators can produce false signals during strong trending phases
Timeframe-based configurations assume consistent session activity
NOTES
• Uses custom calculate_weighted_moving_average implementation with variable weighting emphasis
• Dynamic typing ensures continuous series validity through get_last_valid_value mechanism
• Differential calculations normalized by multiplying GHIST values × 0.5
CREDITS
Inspired by classical stochastic principles refined for modern algorithmic evaluation techniques.
오픈 소스 스크립트
트레이딩뷰의 진정한 정신에 따라, 이 스크립트의 작성자는 이를 오픈소스로 공개하여 트레이더들이 기능을 검토하고 검증할 수 있도록 했습니다. 작성자에게 찬사를 보냅니다! 이 코드는 무료로 사용할 수 있지만, 코드를 재게시하는 경우 하우스 룰이 적용된다는 점을 기억하세요.
Avoid losing contact!Don't miss out! The first and most important thing to do is to join my Discord chat now! Click here to start your adventure: discord.com/invite/ZTGpQJq 防止失联,请立即行动,加入本猫聊天群: discord.com/invite/ZTGpQJq
면책사항
해당 정보와 게시물은 금융, 투자, 트레이딩 또는 기타 유형의 조언이나 권장 사항으로 간주되지 않으며, 트레이딩뷰에서 제공하거나 보증하는 것이 아닙니다. 자세한 내용은 이용 약관을 참조하세요.