OPEN-SOURCE SCRIPT
Volume 2x Average
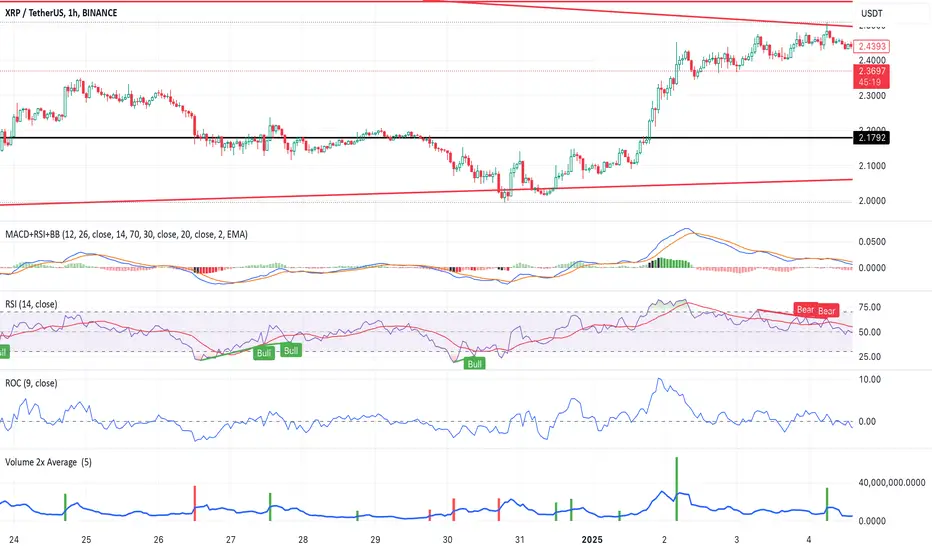
This script helps traders identify stocks or instruments experiencing unusually high trading volume compared to their average volume over a user-defined period. The key features include:
1. Volume 2x Average Filter:
Highlights bars where the current volume is greater than twice the average volume for the selected period.
2. Dynamic Average Period:
Allows users to specify the period for calculating the average volume (e.g., 1 day, 5 days, etc.).
3. Color-Coded Bars:
• Green Bars: Indicate bullish candlesticks where the closing price is higher than the
opening price.
• Red Bars: Indicate bearish candlesticks where the closing price is lower than the
opening price.
4. Optional Bar Visibility:
Users can toggle the visibility of the highlighted volume bars, providing flexibility for clean chart analysis.
5. Average Volume Line:
Plots the average volume as a blue line for reference.
Use Case:
This script is ideal for traders looking to identify potential breakouts, reversals, or key market movements driven by significant volume spikes. By dynamically adjusting the average period and toggling bar visibility, users can tailor the script to fit various trading strategies and timeframes.
Inputs:
1. Show 2x Volume Bars:
• Toggle to enable or disable the display of the highlighted volume bars.
2. Average Volume Period:
• Specify the number of periods (e.g., 1 for 1 day, 5 for 5 days) to calculate the average
volume.
Disclaimer:
This script is for educational purposes only and does not constitute financial advice. Use it alongside your analysis and trading strategy.
오픈 소스 스크립트
트레이딩뷰의 진정한 정신에 따라, 이 스크립트의 작성자는 이를 오픈소스로 공개하여 트레이더들이 기능을 검토하고 검증할 수 있도록 했습니다. 작성자에게 찬사를 보냅니다! 이 코드는 무료로 사용할 수 있지만, 코드를 재게시하는 경우 하우스 룰이 적용된다는 점을 기억하세요.
면책사항
해당 정보와 게시물은 금융, 투자, 트레이딩 또는 기타 유형의 조언이나 권장 사항으로 간주되지 않으며, 트레이딩뷰에서 제공하거나 보증하는 것이 아닙니다. 자세한 내용은 이용 약관을 참조하세요.
오픈 소스 스크립트
트레이딩뷰의 진정한 정신에 따라, 이 스크립트의 작성자는 이를 오픈소스로 공개하여 트레이더들이 기능을 검토하고 검증할 수 있도록 했습니다. 작성자에게 찬사를 보냅니다! 이 코드는 무료로 사용할 수 있지만, 코드를 재게시하는 경우 하우스 룰이 적용된다는 점을 기억하세요.
면책사항
해당 정보와 게시물은 금융, 투자, 트레이딩 또는 기타 유형의 조언이나 권장 사항으로 간주되지 않으며, 트레이딩뷰에서 제공하거나 보증하는 것이 아닙니다. 자세한 내용은 이용 약관을 참조하세요.