INVITE-ONLY SCRIPT
Fibonacci Dashboard-xbos.in
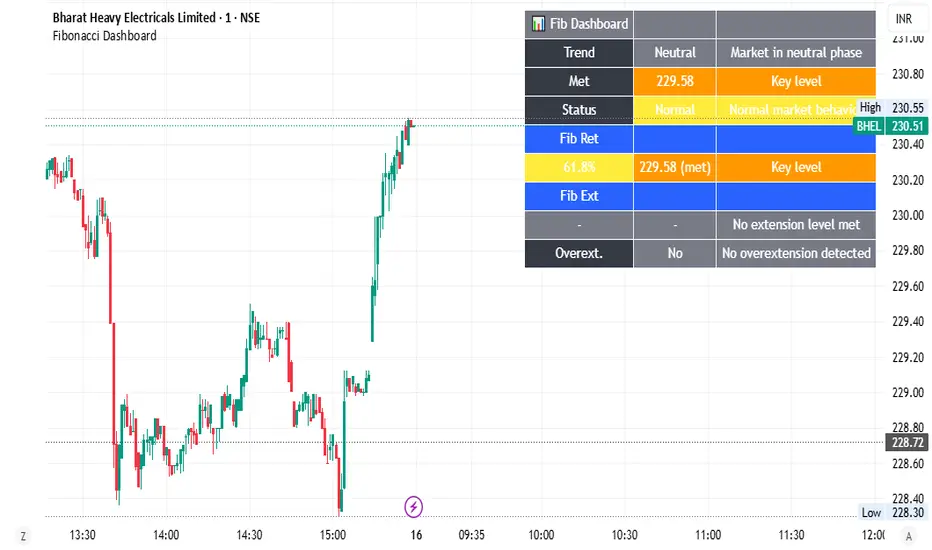
This Fibonacci Dashboard is a technical tool built in Pine Script that helps traders track key Fibonacci retracement and extension levels. It automatically detects the market trend—uptrend, downtrend, or neutral—and displays it with color-coded signals for easy interpretation.
It calculates retracement and extension levels from recent swing highs and lows, helping traders identify where price pullbacks or trend continuations are likely to occur. The retracement levels, like 0.236, 0.382, and 0.618, highlight areas where the price might temporarily correct, while extension levels, such as 1.272 and 1.618, point to zones of breakout or strong momentum.
The dashboard summarizes the current trend, the last Fibonacci level touched, and whether the structure is breaking or behaving normally. Traders can also set alerts on specific levels to be notified when price approaches or crosses them, ensuring timely action.
Additionally, the dashboard is customizable—you can adjust its position, choose which levels to display, and set thresholds for alerts. This makes it a flexible and user-friendly tool for analyzing trends and planning trades efficiently.Main Features
Trend Detection
Identifies whether the market is in an Uptrend, Downtrend, or Neutral based on price movements.
Highlights trends with color-coded signals:
✅ Green → Uptrend
❌ Red → Downtrend
⚪ Gray → Neutral
Fibonacci Levels
Calculates both retracement and extension levels from swing highs and lows.
Helps identify where price corrections and continuations might occur.
Retracement Levels
Shows key Fibonacci retracement ratios:
Extension Levels
Shows key Fibonacci extension ratios
Dashboard Display
Summarizes trend, last met Fibonacci level, and overall market structure.
Provides details about whether the price is at a retracement or extension level and what it means.
Status field signals whether the structure is breaking, a breakout is occurring, or the market is behaving normally.
Alerts
You can set alerts on specific retracement and extension levels.
Alerts are triggered when the price crosses or approaches these levels within a tolerance threshold.
Customization
Dashboard position can be adjusted (top-right, top-left, bottom-right, bottom-left).
Volume threshold for triggering alerts is customizable.
Show/hide retracements and extensions.
초대 전용 스크립트
이 스크립트는 작성자가 승인한 사용자만 접근할 수 있습니다. 사용하려면 요청을 보내고 승인을 받아야 합니다. 일반적으로 결제 후에 승인이 이루어집니다. 자세한 내용은 아래 작성자의 지침을 따르거나 xbos에게 직접 문의하세요.
트레이딩뷰는 스크립트 작성자를 완전히 신뢰하고 스크립트 작동 방식을 이해하지 않는 한 스크립트 비용을 지불하거나 사용하지 않는 것을 권장하지 않습니다. 무료 오픈소스 대체 스크립트는 커뮤니티 스크립트에서 찾을 수 있습니다.
작성자 지시 사항
The Fibonacci Dashboard is a user-friendly tool that tracks key retracement and extension levels, identifies market trends with color-coded signals, and provides customizable alerts to help traders plan entries and exits more effectively.
Powered by XBOS – Technical setups made simple 📈 | xbos.in
면책사항
이 정보와 게시물은 TradingView에서 제공하거나 보증하는 금융, 투자, 거래 또는 기타 유형의 조언이나 권고 사항을 의미하거나 구성하지 않습니다. 자세한 내용은 이용 약관을 참고하세요.