OPEN-SOURCE SCRIPT
업데이트됨 [blackcat] L2 Bull-Bear Momentum
Level 2
Background
Momentum effect is generally called "inertia effect". Momentum effect was proposed by Jegadeesh and Titman (1993), which refers to the tendency of the return rate of the stock to continue the original direction of movement, that is, the return rate of the stock with a higher return rate in the past period will still be higher than the return rate in the past low-yielding stocks.
Function
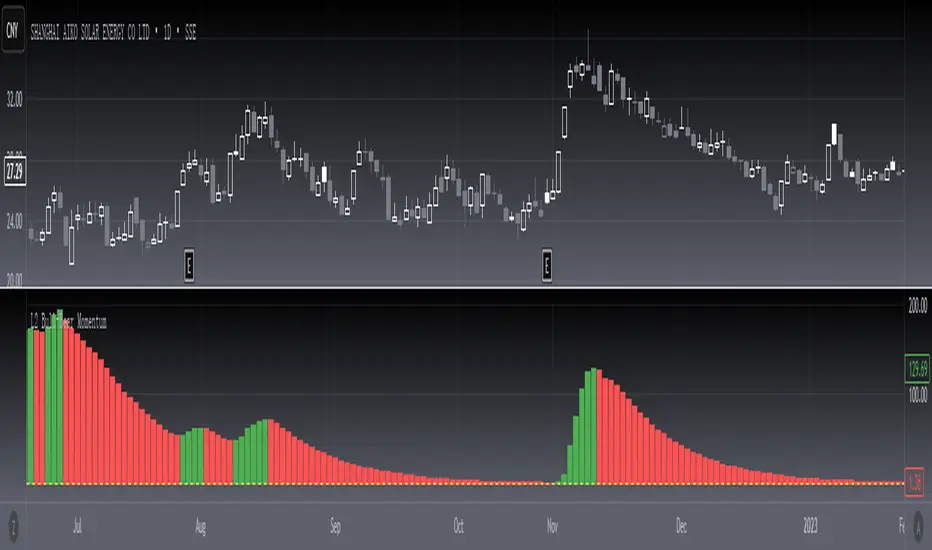
The Bullish and Bearish Momentum Technical Indicator is a strategy for buying and selling by analyzing the strength and weakness of recent price trends. Traders seek to take advantage of the rising or falling trend of stock prices. When this technical indicator indicates that the stock is entering a strong upward trend, the trader will buy the stock; Will choose to short the stock.
In short, momentum trading is trading with the trend. Momentum trading is based on the idea that if there is enough momentum behind the current price action, it will continue to move in the same direction. When an asset reaches a higher price, it usually attracts more investor attention, driving up the market price. The price rise continues until sellers start to enter the market consistently, and once sellers slowly outpace buyers, momentum weakens and the trend may reverse.
I have not marked special tags for this indicator usage. Users are expected to define according to their own understanding. On the whole, the basic usage is to start long positions when the first green column appears; when the first red column appears, close long positions or open short positions.
Remarks
Feedbacks are appreciated.
Background
Momentum effect is generally called "inertia effect". Momentum effect was proposed by Jegadeesh and Titman (1993), which refers to the tendency of the return rate of the stock to continue the original direction of movement, that is, the return rate of the stock with a higher return rate in the past period will still be higher than the return rate in the past low-yielding stocks.
Function
The Bullish and Bearish Momentum Technical Indicator is a strategy for buying and selling by analyzing the strength and weakness of recent price trends. Traders seek to take advantage of the rising or falling trend of stock prices. When this technical indicator indicates that the stock is entering a strong upward trend, the trader will buy the stock; Will choose to short the stock.
In short, momentum trading is trading with the trend. Momentum trading is based on the idea that if there is enough momentum behind the current price action, it will continue to move in the same direction. When an asset reaches a higher price, it usually attracts more investor attention, driving up the market price. The price rise continues until sellers start to enter the market consistently, and once sellers slowly outpace buyers, momentum weakens and the trend may reverse.
I have not marked special tags for this indicator usage. Users are expected to define according to their own understanding. On the whole, the basic usage is to start long positions when the first green column appears; when the first red column appears, close long positions or open short positions.
Remarks
Feedbacks are appreciated.
릴리즈 노트
OVERVIEW The **L2 Bull-Bear Momentum** indicator provides traders with a sophisticated approach to identifying market trends using both bullish and bearish momentum calculations. It combines multiple technical analysis techniques including EMAs, price ranges, and volume-weighted averages to generate accurate trading signals. 📈This advanced indicator uses complex mathematical formulas to detect potential entry points in the market, making it particularly useful for day traders and swing traders looking for precise timing opportunities. The script employs customizable scaling factors to adjust signal sensitivity according to individual trader preferences. ⚙️
FEATURES
• Advanced momentum calculation combining:
Price range analysis
EMA crossovers
Volume-weighted price products
Deviation factors
• Customizable scaling factor for signal adjustment 🔧
• Real-time buy/sell signal generation ✅
• Visual representation through colored columns and labels 🎨
HOW TO USE
Apply the indicator to your chart
Adjust the scaling factor input to fine-tune signal strength
Monitor column colors:
Green columns indicate bullish momentum 👆
Red columns show bearish momentum 👇
Watch for crossover points between green and red zones
Use labeled signals as confirmation points for trades
LIMITATIONS
• May produce false signals during highly volatile periods ⚠️
• Best results on daily charts or higher timeframes
• Requires careful parameter tuning for optimal performance
NOTES
The indicator uses multiple smoothing techniques to reduce noise
Signal strength varies based on market conditions
Always combine with other tools for robust trade decisions
THANKS
Special thanks to the TradingView community for providing inspiration and feedback. This script builds upon shared knowledge from various contributors. 💡
오픈 소스 스크립트
트레이딩뷰의 진정한 정신에 따라, 이 스크립트의 작성자는 이를 오픈소스로 공개하여 트레이더들이 기능을 검토하고 검증할 수 있도록 했습니다. 작성자에게 찬사를 보냅니다! 이 코드는 무료로 사용할 수 있지만, 코드를 재게시하는 경우 하우스 룰이 적용된다는 점을 기억하세요.
Avoid losing contact!Don't miss out! The first and most important thing to do is to join my Discord chat now! Click here to start your adventure: discord.com/invite/ZTGpQJq 防止失联,请立即行动,加入本猫聊天群: discord.com/invite/ZTGpQJq
면책사항
해당 정보와 게시물은 금융, 투자, 트레이딩 또는 기타 유형의 조언이나 권장 사항으로 간주되지 않으며, 트레이딩뷰에서 제공하거나 보증하는 것이 아닙니다. 자세한 내용은 이용 약관을 참조하세요.