PROTECTED SOURCE SCRIPT
업데이트됨 NJAlgoSignalv2
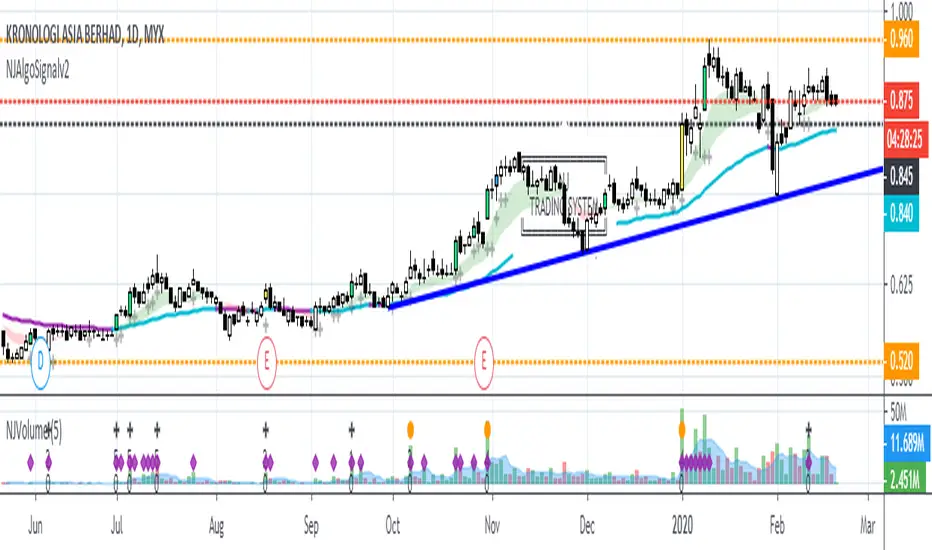
NJ-ALGO-SIGNAL
Combination of Price Breakout with Volume
Bar Color
Yellow = Breakout with Volume and Trend Change
Lime = Breakout with Volume
Blue = Breakout without Volume
Black Line = Trailing Stop Line
Sell when price break the Stop Loss Line.
Try to entry on Yellow and Lime Candle.
Can consider to exit when Blue Candle occur. Sign of weakness on uptrend.
Label
Shows only when bar color condition meet
Calculate risk level based on the current price and trailing stop loss line (Black Line).
52W High
By default is off.
Background Color
To Indicate Bullish or Bearish zone.
Green = Bullish zone
Red = Bearish zone
릴리즈 노트
- Add 52Week High/Low Line- Add Trend Cloud
- Add EMA 50
- Show/Hide previous stop loss point
보호된 스크립트입니다
이 스크립트는 비공개 소스로 게시됩니다. 하지만 이를 자유롭게 제한 없이 사용할 수 있습니다 – 자세한 내용은 여기에서 확인하세요.
면책사항
해당 정보와 게시물은 금융, 투자, 트레이딩 또는 기타 유형의 조언이나 권장 사항으로 간주되지 않으며, 트레이딩뷰에서 제공하거나 보증하는 것이 아닙니다. 자세한 내용은 이용 약관을 참조하세요.
보호된 스크립트입니다
이 스크립트는 비공개 소스로 게시됩니다. 하지만 이를 자유롭게 제한 없이 사용할 수 있습니다 – 자세한 내용은 여기에서 확인하세요.
면책사항
해당 정보와 게시물은 금융, 투자, 트레이딩 또는 기타 유형의 조언이나 권장 사항으로 간주되지 않으며, 트레이딩뷰에서 제공하거나 보증하는 것이 아닙니다. 자세한 내용은 이용 약관을 참조하세요.