PROTECTED SOURCE SCRIPT
TB Sniper
Welcome everyone to your new base indicator, the TB Sniper.
Want to catch market tops and bottoms? You're in the right place!
Be ahead of of the game with the ability to catch market tops and bottoms.
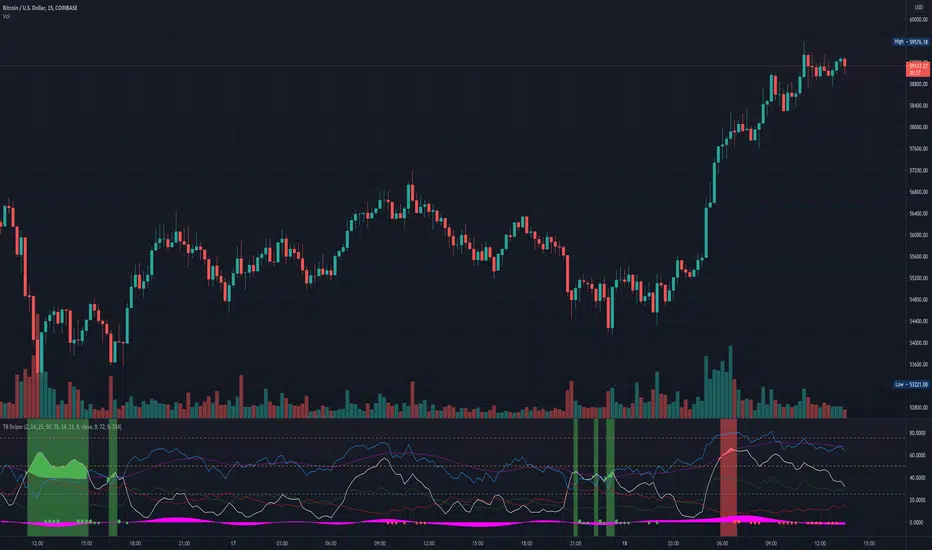
This indicator combines a range of momentum and oscillation indicators to give you a decent chance of catching the highs and lows, relative to the timeframe it is used on. This information is critical in analysing where to buy and sell and to give you a view of the overall health of the pair you are trading.
In addition to finding the relative tops and bottoms, it also shows you the RSI, DMI and MACD histogram for further confluence in your decision making.
The indicator will flash a green background when it thinks it is close to a bottom or a red background when it thinks it is close to a top. Further indications are shown when the indicator thinks it is now a good time to buy (large green circle shown) or sell (large red circle shown). These large circles work very well when longing/shorting the market and when overall price action is in the direction of the signal. E.g. In an uptrend, a large green circle will indicate a good time to buy/long. In a downtrend, a red circle will indicate a good time to sell/short. The indicator will show auxiliary indications (small circles) when it thinks it would be a good time to take profit. A small green circle indicates a possible time to take profit after buying/longing, while a small red circle indicates a possible time to take profit after selling/shorting.
This script works very well on the 15 minute timeframe with the default settings on most symbols, especially cryptocurrency. Usually, the larger the timeframe, the bigger the move.
Want to catch market tops and bottoms? You're in the right place!
Be ahead of of the game with the ability to catch market tops and bottoms.
This indicator combines a range of momentum and oscillation indicators to give you a decent chance of catching the highs and lows, relative to the timeframe it is used on. This information is critical in analysing where to buy and sell and to give you a view of the overall health of the pair you are trading.
In addition to finding the relative tops and bottoms, it also shows you the RSI, DMI and MACD histogram for further confluence in your decision making.
The indicator will flash a green background when it thinks it is close to a bottom or a red background when it thinks it is close to a top. Further indications are shown when the indicator thinks it is now a good time to buy (large green circle shown) or sell (large red circle shown). These large circles work very well when longing/shorting the market and when overall price action is in the direction of the signal. E.g. In an uptrend, a large green circle will indicate a good time to buy/long. In a downtrend, a red circle will indicate a good time to sell/short. The indicator will show auxiliary indications (small circles) when it thinks it would be a good time to take profit. A small green circle indicates a possible time to take profit after buying/longing, while a small red circle indicates a possible time to take profit after selling/shorting.
This script works very well on the 15 minute timeframe with the default settings on most symbols, especially cryptocurrency. Usually, the larger the timeframe, the bigger the move.
보호된 스크립트입니다
이 스크립트는 비공개 소스로 게시됩니다. 하지만 이를 자유롭게 제한 없이 사용할 수 있습니다 – 자세한 내용은 여기에서 확인하세요.
면책사항
해당 정보와 게시물은 금융, 투자, 트레이딩 또는 기타 유형의 조언이나 권장 사항으로 간주되지 않으며, 트레이딩뷰에서 제공하거나 보증하는 것이 아닙니다. 자세한 내용은 이용 약관을 참조하세요.
보호된 스크립트입니다
이 스크립트는 비공개 소스로 게시됩니다. 하지만 이를 자유롭게 제한 없이 사용할 수 있습니다 – 자세한 내용은 여기에서 확인하세요.
면책사항
해당 정보와 게시물은 금융, 투자, 트레이딩 또는 기타 유형의 조언이나 권장 사항으로 간주되지 않으며, 트레이딩뷰에서 제공하거나 보증하는 것이 아닙니다. 자세한 내용은 이용 약관을 참조하세요.