OPEN-SOURCE SCRIPT
업데이트됨 Purple Cloud
The above lines calculate several intermediate values used in the indicator's calculations. Here's a breakdown of each variable:
a1: Represents a modified Exponential Moving Average (EMA) of the high price series, subtracted by a Simple Moving Average (SMA) of the low price series.
a2: Takes the square root of the lowest value between the highest close price over the last 200 bars and the current close price, multiplied by a1.
b1: Represents a modified EMA of the low price series, subtracted by an SMA of the high price series.
b2: Takes the square root of the highest value between the lowest close price over the last 200 bars and the current close price, multiplied by b1.
c1: Represents the square root of a2 multiplied by b2.
These lines create multiple plots using the plot function. Each plot represents a displaced version of c1 by a certain multiple of the Average True Range (ATR) multiplied by a constant factor (0.1, 0.2, 0.3, etc.). The transparency (transp) is set to 100 for all plots.
릴리즈 노트
Add Alpha 릴리즈 노트
Added Pink Green Yellow bar.Green Bar--->Buy
Pink Bar--->Sell
Yellow Bar--->Unstable
릴리즈 노트
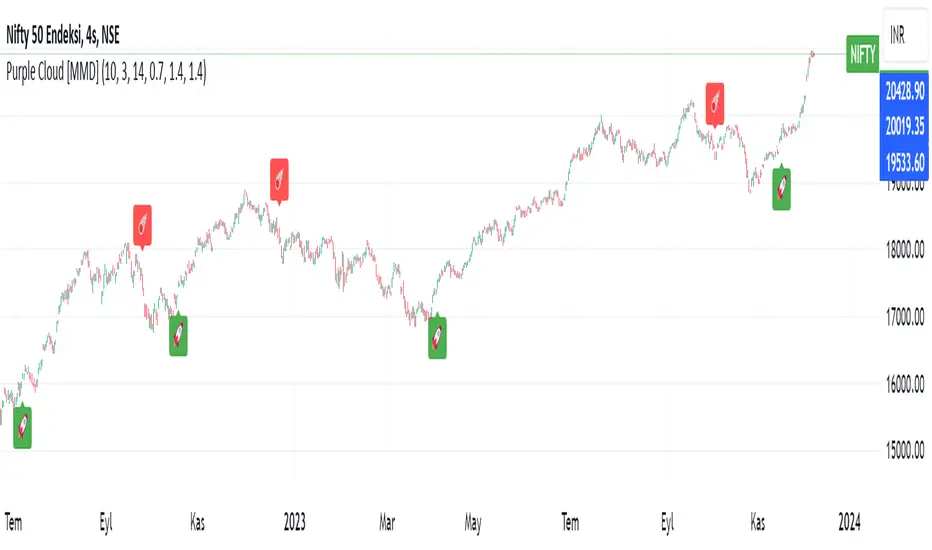
I added Maybe Pump Maybe Dump릴리즈 노트
Added Rsi Background Color릴리즈 노트
Deleted Clouds릴리즈 노트
Added Bomb Pump Dump릴리즈 노트
Changed All릴리즈 노트
Change Name릴리즈 노트
added alert and funcs릴리즈 노트
Added colour릴리즈 노트
Added MMD Bands릴리즈 노트
Added Supertrend and Ema 200 50 20릴리즈 노트
Added Buying Pressure Threshold % and Selling Pressure Threshold % and changed formula오픈 소스 스크립트
트레이딩뷰의 진정한 정신에 따라, 이 스크립트의 작성자는 이를 오픈소스로 공개하여 트레이더들이 기능을 검토하고 검증할 수 있도록 했습니다. 작성자에게 찬사를 보냅니다! 이 코드는 무료로 사용할 수 있지만, 코드를 재게시하는 경우 하우스 룰이 적용된다는 점을 기억하세요.
면책사항
해당 정보와 게시물은 금융, 투자, 트레이딩 또는 기타 유형의 조언이나 권장 사항으로 간주되지 않으며, 트레이딩뷰에서 제공하거나 보증하는 것이 아닙니다. 자세한 내용은 이용 약관을 참조하세요.
오픈 소스 스크립트
트레이딩뷰의 진정한 정신에 따라, 이 스크립트의 작성자는 이를 오픈소스로 공개하여 트레이더들이 기능을 검토하고 검증할 수 있도록 했습니다. 작성자에게 찬사를 보냅니다! 이 코드는 무료로 사용할 수 있지만, 코드를 재게시하는 경우 하우스 룰이 적용된다는 점을 기억하세요.
면책사항
해당 정보와 게시물은 금융, 투자, 트레이딩 또는 기타 유형의 조언이나 권장 사항으로 간주되지 않으며, 트레이딩뷰에서 제공하거나 보증하는 것이 아닙니다. 자세한 내용은 이용 약관을 참조하세요.