OPEN-SOURCE SCRIPT
DMI Modified
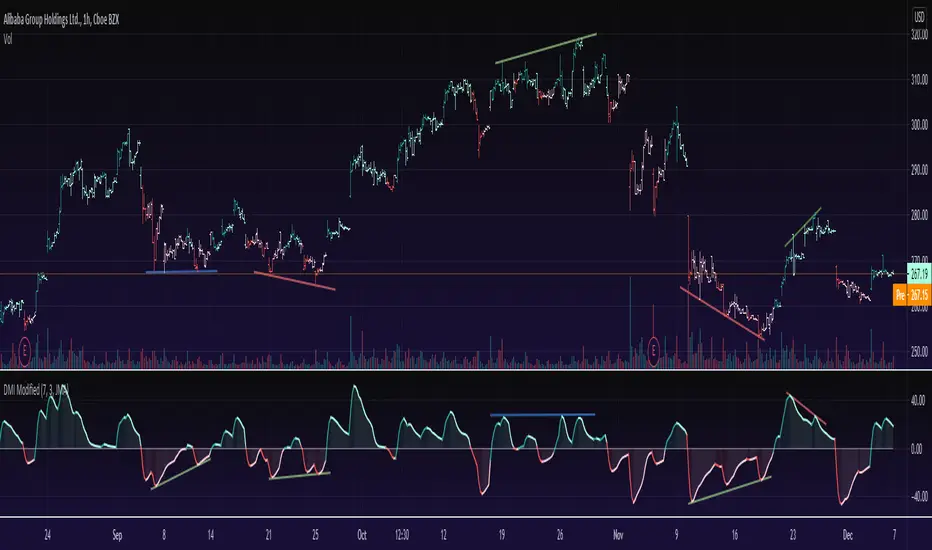
This is a Directional Movement Index (DMI) with a twist, instead of plotting the positive direction of +DI and negative direction for -DI, we subtract the +DI with the -DI on scales of 100 to -100.
The result is plotted with a oscillator to identify the current trend.
DMI Modified supports multiple moving averages (default is JMA with length of 3). You can disable moving averages smoothing in settings.
== About the indicator ==
The Directional Movement Index, or DMI, is an indicator developed by J. Welles Wilder in 1978 that identifies in which direction the price of an asset is moving.
The indicator does this by comparing prior highs and lows and drawing two lines: a positive directional movement line (+DI) and a negative directional movement line (-DI)
In our case we do not draw the two lines, but the result of the subtraction of the two.
== Oscillator Colors ==
GREEN : Asset is above zero line with a strong up trend.
LIGHT GREEN: Asset is above zero line but up trending might be weakening.
RED : Asset is below zero line with a strong downtrend.
LIGHT RED: Asset is below zero line but down trending might be weakening.
== Notes ==
Can also be used to find divergences.
Bar coloring is disabled by default
Like if you like and Enjoy!
There is an idea to make a new strategy combined with DMI Modified (this script) and another script, hench, Follow.
오픈 소스 스크립트
트레이딩뷰의 진정한 정신에 따라, 이 스크립트의 작성자는 이를 오픈소스로 공개하여 트레이더들이 기능을 검토하고 검증할 수 있도록 했습니다. 작성자에게 찬사를 보냅니다! 이 코드는 무료로 사용할 수 있지만, 코드를 재게시하는 경우 하우스 룰이 적용된다는 점을 기억하세요.
Appreciation of my work: paypal.me/dman103
All Premium indicators: algo.win
LIVE Stream - Pivot Points Algo: youtube.com/channel/UCFyqab-i0xb2jf-c18ufH0A/live
All Premium indicators: algo.win
LIVE Stream - Pivot Points Algo: youtube.com/channel/UCFyqab-i0xb2jf-c18ufH0A/live
면책사항
해당 정보와 게시물은 금융, 투자, 트레이딩 또는 기타 유형의 조언이나 권장 사항으로 간주되지 않으며, 트레이딩뷰에서 제공하거나 보증하는 것이 아닙니다. 자세한 내용은 이용 약관을 참조하세요.