OPEN-SOURCE SCRIPT
RSI-Last-3-Extrema
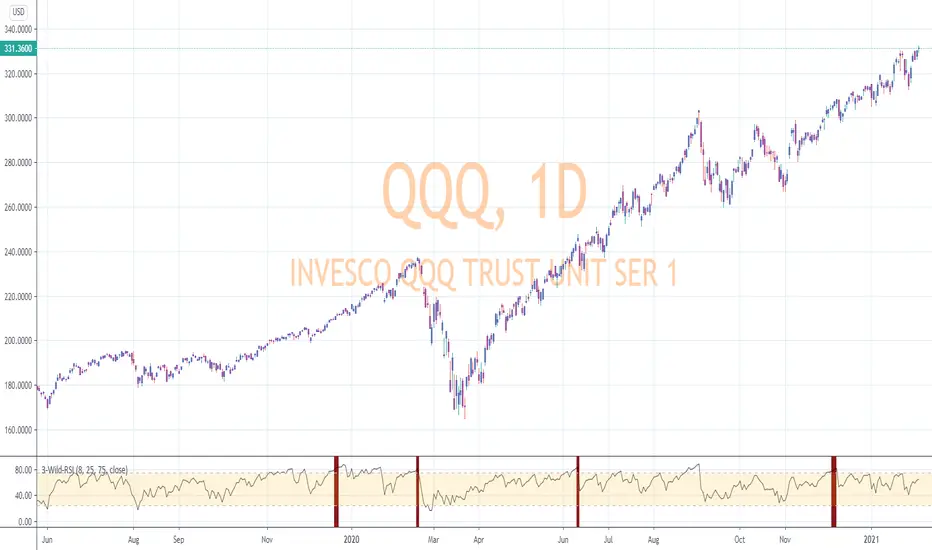
This script indicates when the current Relative Strength Index of the last 8 closes is beyond a level from center oscillation which signals the equity is likely to reverse course. When it is the lowest RSI reading of the prior 3 readings and below 25, a green vertical bar will appear signaling a potential BUY point. Likewise, the highest reading of the prior 3 RSI readings and above 75 will signal a vertical red bar or SELL signal. The bar has to have a final close price for the signal to be active. Reversal could take a few more bars to occur depending on the timeframe and equity symbol.
You will be able to find many charts that have this signal perfectly finding the top or bottom of a significant trend.
It successfully indicates profitable reversal around 80% of the time. So far, It is 85% accurate or better in determining downtrend start points on the Daily, 120, 60, 30 Minute charts according to the study of more than 10,000 occurrences. It is 86% accurate on the 30 Minute chart.
This is another tool I use in finding or confirming potential price action. Hope you find it useful.
To add this, favorite the script by clicking "Add to your Favorite Indicators" at the top of the code portion below. On your top tool bar is an "fx" button with a downward arrow to the right of it. Click on the downward arrow/caret and scroll down to "RSI-Last-3-Extrema". Click on this title and it should add to the bottom of your current chart. If you do not see BUY (green vertical bars) or SELL (red vertical bars) right away, try other charts and timeframes.
오픈 소스 스크립트
트레이딩뷰의 진정한 정신에 따라, 이 스크립트의 작성자는 이를 오픈소스로 공개하여 트레이더들이 기능을 검토하고 검증할 수 있도록 했습니다. 작성자에게 찬사를 보냅니다! 이 코드는 무료로 사용할 수 있지만, 코드를 재게시하는 경우 하우스 룰이 적용된다는 점을 기억하세요.
All forecasts are based on analysis of past behavior. Prior movements are not always indicative of future movement. Develop the theory, test the theory. Do your own research. Nothing in this analysis constitutes advice. YouTube For More. Good luck!!
면책사항
해당 정보와 게시물은 금융, 투자, 트레이딩 또는 기타 유형의 조언이나 권장 사항으로 간주되지 않으며, 트레이딩뷰에서 제공하거나 보증하는 것이 아닙니다. 자세한 내용은 이용 약관을 참조하세요.