OPEN-SOURCE SCRIPT
Katik Cycle 56 Days
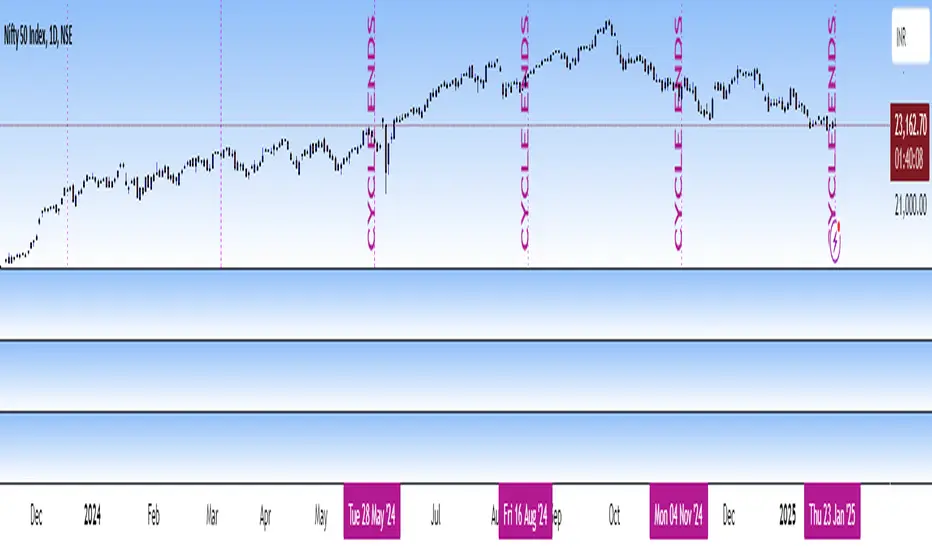
This script plots vertical dotted lines on the chart every 56 trading days, starting from the first bar. It calculates intervals based on the bar_index and draws the lines for both historical and future dates by projecting the lines forward.
The lines are extended across the entire chart height using extend=extend.both, ensuring visibility regardless of chart zoom level. You can customize the interval length using the input box.
Note: Use this only for 1D (Day) candle so that you can find the changes in the trend...
The lines are extended across the entire chart height using extend=extend.both, ensuring visibility regardless of chart zoom level. You can customize the interval length using the input box.
Note: Use this only for 1D (Day) candle so that you can find the changes in the trend...
오픈 소스 스크립트
트레이딩뷰의 진정한 정신에 따라, 이 스크립트의 작성자는 이를 오픈소스로 공개하여 트레이더들이 기능을 검토하고 검증할 수 있도록 했습니다. 작성자에게 찬사를 보냅니다! 이 코드는 무료로 사용할 수 있지만, 코드를 재게시하는 경우 하우스 룰이 적용된다는 점을 기억하세요.
면책사항
해당 정보와 게시물은 금융, 투자, 트레이딩 또는 기타 유형의 조언이나 권장 사항으로 간주되지 않으며, 트레이딩뷰에서 제공하거나 보증하는 것이 아닙니다. 자세한 내용은 이용 약관을 참조하세요.
오픈 소스 스크립트
트레이딩뷰의 진정한 정신에 따라, 이 스크립트의 작성자는 이를 오픈소스로 공개하여 트레이더들이 기능을 검토하고 검증할 수 있도록 했습니다. 작성자에게 찬사를 보냅니다! 이 코드는 무료로 사용할 수 있지만, 코드를 재게시하는 경우 하우스 룰이 적용된다는 점을 기억하세요.
면책사항
해당 정보와 게시물은 금융, 투자, 트레이딩 또는 기타 유형의 조언이나 권장 사항으로 간주되지 않으며, 트레이딩뷰에서 제공하거나 보증하는 것이 아닙니다. 자세한 내용은 이용 약관을 참조하세요.