PROTECTED SOURCE SCRIPT
DWP_Fabric_of_Time
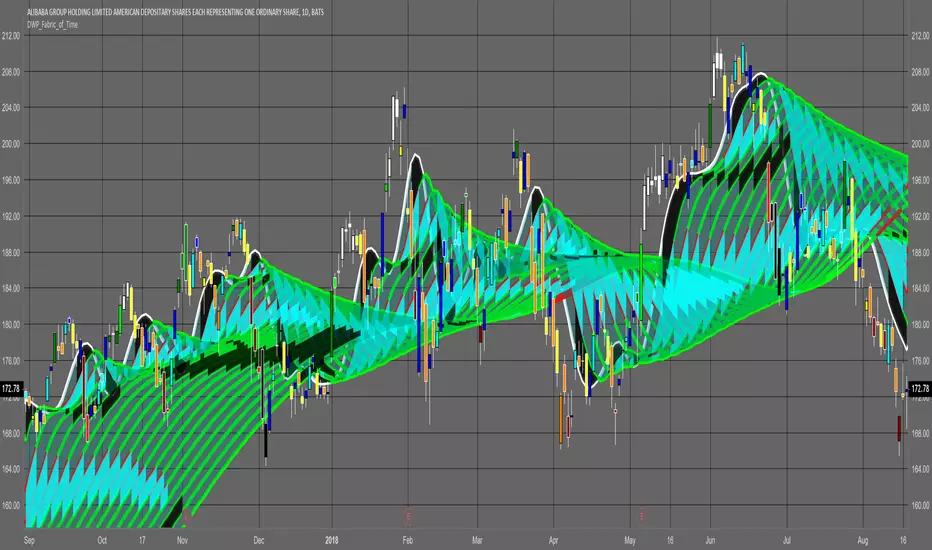
Hello, The following is an indicator I wrote that shows the resistance or support created by the contraction or expansion of moving averages of price over time. The theory is that the areas created by either the decline or acceleration of sma lines are caused by either fear or excitement in the market thus marking the area for future support or resistance to take place. The light blue blocks indicate a decrease in expansion till no expansion. The dark black blocks indicate a decrease in contraction till no contraction. Both blocks can be support or resistance. Once a block is breached look for a reversal. if the block is penetrated over half-way then it will usually continue to the other side before reversing. Their is a multiplier in the script to allow expansion of the indicator. I have also added a bar color indicator for the strength of the move. This can be turned on or off in settings. The colors are paired up as such.
Up = aqua, blue,green, lime,white. | Down = yellow, orange,maroon, red,black.
Hope this helps visualize the market.
Good Trading MoveTrap

Up = aqua, blue,green, lime,white. | Down = yellow, orange,maroon, red,black.
Hope this helps visualize the market.
Good Trading MoveTrap
보호된 스크립트입니다
이 스크립트는 비공개 소스로 게시됩니다. 하지만 이를 자유롭게 제한 없이 사용할 수 있습니다 – 자세한 내용은 여기에서 확인하세요.
면책사항
해당 정보와 게시물은 금융, 투자, 트레이딩 또는 기타 유형의 조언이나 권장 사항으로 간주되지 않으며, 트레이딩뷰에서 제공하거나 보증하는 것이 아닙니다. 자세한 내용은 이용 약관을 참조하세요.
면책사항
해당 정보와 게시물은 금융, 투자, 트레이딩 또는 기타 유형의 조언이나 권장 사항으로 간주되지 않으며, 트레이딩뷰에서 제공하거나 보증하는 것이 아닙니다. 자세한 내용은 이용 약관을 참조하세요.