PROTECTED SOURCE SCRIPT
VIX Delta Sentiment
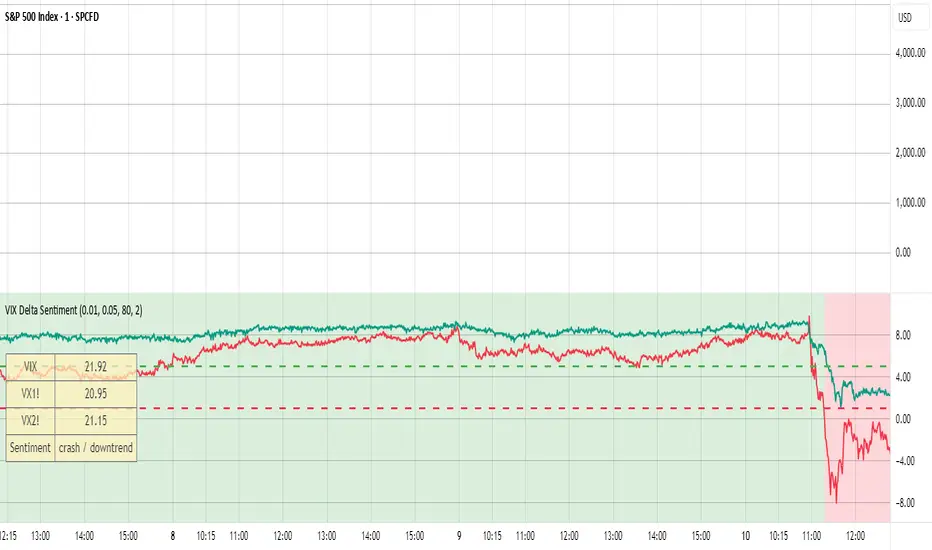
This script opens a new panel underneath the main panel.
It displays a table with the values of the CBOE volatility index VIX, which measures the last 30 days implied volatility of the S&P500 index, the VX1! and the VX2! values, which are the front month and the second month VIX futures.
To curves are plotted: the relative difference or delta of the two VIX futures as well as the relative delta between VIX and the first futures month. The dotted lines visualize the thresholds of these two relative deltas.
These values are needed to determine the market sentiment and to trigger a crash alert before it happens. It can be used to trade the major indices SPX, QQQ, etc. or to avoid catastrophic losses.
The market sentiment is annotated in the table and also visualized as background color.
보호된 스크립트입니다
이 스크립트는 비공개 소스로 게시됩니다. 하지만 이를 자유롭게 제한 없이 사용할 수 있습니다 – 자세한 내용은 여기에서 확인하세요.
면책사항
해당 정보와 게시물은 금융, 투자, 트레이딩 또는 기타 유형의 조언이나 권장 사항으로 간주되지 않으며, 트레이딩뷰에서 제공하거나 보증하는 것이 아닙니다. 자세한 내용은 이용 약관을 참조하세요.
보호된 스크립트입니다
이 스크립트는 비공개 소스로 게시됩니다. 하지만 이를 자유롭게 제한 없이 사용할 수 있습니다 – 자세한 내용은 여기에서 확인하세요.
면책사항
해당 정보와 게시물은 금융, 투자, 트레이딩 또는 기타 유형의 조언이나 권장 사항으로 간주되지 않으며, 트레이딩뷰에서 제공하거나 보증하는 것이 아닙니다. 자세한 내용은 이용 약관을 참조하세요.