OPEN-SOURCE SCRIPT
업데이트됨 Price × Volume Table
It creates a table showing:
1- Daily Close × Daily Volume
2- Current Close × Current Volume
3- Close × Highest Volume (last 360 candles)
1- Daily Close × Daily Volume
2- Current Close × Current Volume
3- Close × Highest Volume (last 360 candles)
릴리즈 노트
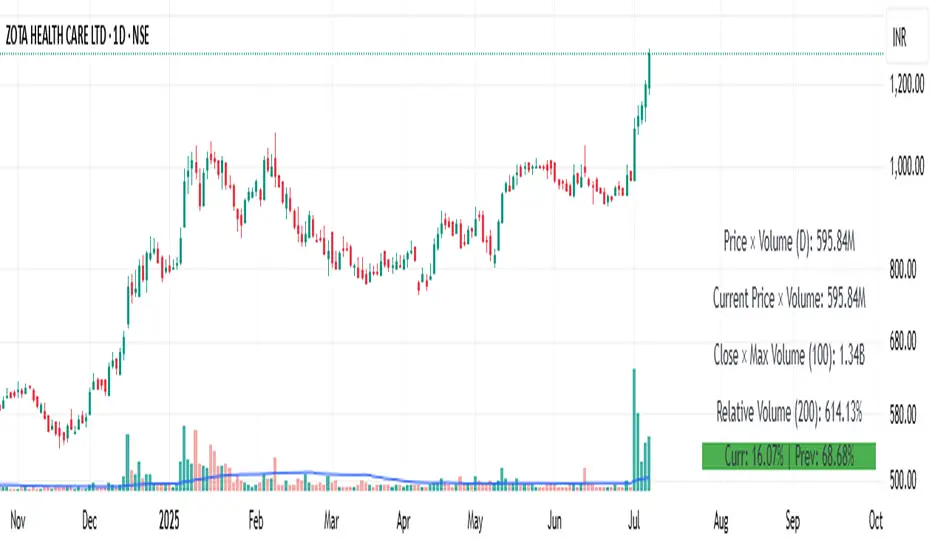
This indicator displays a real-time table showing important volume and liquidity metrics to help traders assess market activity at a glance.Included Metrics:
Price × Volume (1D): Daily closing price × volume from the selected higher timeframe (default: 1D).
Current Price × Volume: Live price × volume for the current bar.
Close × Max Volume (Lookback): Current close multiplied by the highest volume observed over a user-defined lookback period (default: 360 candles).
Relative Volume (RVOL %): Compares current volume with its moving average (default MA: 200) and shows the result as a percentage.
User Settings:
Toggle any of the 4 rows on/off
Customize the moving average length for RVOL
Choose the lookback period for highest volume
Select the timeframe for daily data
Use Case:
This tool helps traders:
Spot volume anomalies
Gauge institutional interest via RVOL
Identify high-liquidity conditions for entries/exits
Notes:
Table is positioned in the bottom-right corner
All values are auto-formatted (e.g., 1.5M, 3.2B)
Compatible with all instruments and timeframes
릴리즈 노트
Feature Added:- 1- Current candle volume change
2- Previous candle Volume change
오픈 소스 스크립트
트레이딩뷰의 진정한 정신에 따라, 이 스크립트의 작성자는 이를 오픈소스로 공개하여 트레이더들이 기능을 검토하고 검증할 수 있도록 했습니다. 작성자에게 찬사를 보냅니다! 이 코드는 무료로 사용할 수 있지만, 코드를 재게시하는 경우 하우스 룰이 적용된다는 점을 기억하세요.
면책사항
해당 정보와 게시물은 금융, 투자, 트레이딩 또는 기타 유형의 조언이나 권장 사항으로 간주되지 않으며, 트레이딩뷰에서 제공하거나 보증하는 것이 아닙니다. 자세한 내용은 이용 약관을 참조하세요.
오픈 소스 스크립트
트레이딩뷰의 진정한 정신에 따라, 이 스크립트의 작성자는 이를 오픈소스로 공개하여 트레이더들이 기능을 검토하고 검증할 수 있도록 했습니다. 작성자에게 찬사를 보냅니다! 이 코드는 무료로 사용할 수 있지만, 코드를 재게시하는 경우 하우스 룰이 적용된다는 점을 기억하세요.
면책사항
해당 정보와 게시물은 금융, 투자, 트레이딩 또는 기타 유형의 조언이나 권장 사항으로 간주되지 않으며, 트레이딩뷰에서 제공하거나 보증하는 것이 아닙니다. 자세한 내용은 이용 약관을 참조하세요.