OPEN-SOURCE SCRIPT
업데이트됨 Psychological Lines
**The Option Chain Shows Strike Price Levels per Index Option**
- **Bank Nifty Index:** 100-point difference or gap between two strike prices.
- **Nifty 50 Index:** 50-point difference or gap between two strike prices.
- **FinNifty 50 Index:** 50-point difference or gap between two strike prices.
**Importance of These Levels:**
- When prices trade at these levels, the option premium either increases or decreases.
- Round numbers always affect option prices.
- Psychological round numbers have a significant impact and act as support and resistance.
- More strangle or straddle positions are created at these levels.
- More call writers or put writers trade at these levels.
**Benefits of Plotting Levels on Charts:**
- Having levels to plot on the chart is always helpful while trading and aids in taking trade positions accordingly.
**Indicator Features:**
- Helps users with various functionalities.
- Allows users to plot lines as needed and adjust the gap between lines as per requirements or option strikes.
- User input to show the number of lines on the chart.
- Tooltip on each level, indicating the current price (LTP) and the difference in points from the LTP.
- Simple to use.
- User-friendly.
- Enhances trading experience with the help of lines.
---
These adjustments should make the text clearer and more professional. If you need any further changes, feel free to ask!
릴리즈 노트
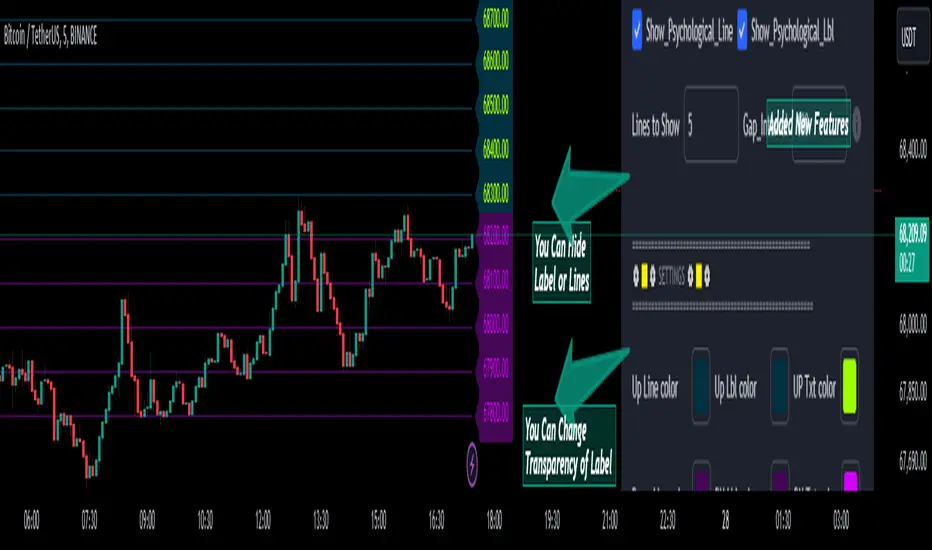
Now that the Script is Updated the overlapping of label & Line issue is solved.릴리즈 노트
Group & Settings Added ( Updated)릴리즈 노트
The improved script looks well-organized and feature-rich! Here are a few notable enhancements and additions in the code:
User Input for Customization: The script allows users to customize the number of lines, gap interval, line and label colors, transparency, and line width. This makes it highly adaptable to different charting needs.
Tooltips: You've added tooltips to the labels, which provide detailed information about the lines and their positions relative to the current close price. This is a great feature for better understanding and analysis.
Conditional Display: Lines and labels are drawn based on user input, ensuring that unnecessary elements are not plotted if not needed.
Color and Transparency: Customizable colors and transparency for labels enhance visual clarity and chart readability.
This updated version should provide a cleaner and more informative chart experience. If you have any specific questions or need further improvements, feel free to ask!
오픈 소스 스크립트
트레이딩뷰의 진정한 정신에 따라, 이 스크립트의 작성자는 이를 오픈소스로 공개하여 트레이더들이 기능을 검토하고 검증할 수 있도록 했습니다. 작성자에게 찬사를 보냅니다! 이 코드는 무료로 사용할 수 있지만, 코드를 재게시하는 경우 하우스 룰이 적용된다는 점을 기억하세요.
면책사항
해당 정보와 게시물은 금융, 투자, 트레이딩 또는 기타 유형의 조언이나 권장 사항으로 간주되지 않으며, 트레이딩뷰에서 제공하거나 보증하는 것이 아닙니다. 자세한 내용은 이용 약관을 참조하세요.
오픈 소스 스크립트
트레이딩뷰의 진정한 정신에 따라, 이 스크립트의 작성자는 이를 오픈소스로 공개하여 트레이더들이 기능을 검토하고 검증할 수 있도록 했습니다. 작성자에게 찬사를 보냅니다! 이 코드는 무료로 사용할 수 있지만, 코드를 재게시하는 경우 하우스 룰이 적용된다는 점을 기억하세요.
면책사항
해당 정보와 게시물은 금융, 투자, 트레이딩 또는 기타 유형의 조언이나 권장 사항으로 간주되지 않으며, 트레이딩뷰에서 제공하거나 보증하는 것이 아닙니다. 자세한 내용은 이용 약관을 참조하세요.