OPEN-SOURCE SCRIPT
SRG Fibs Smoothed
PLEASE READ: HOW TO UNDERSTAND HOW THIS INDICATOR WORKS FOR ME!
Why did I code this?
I never know where is the best place to buy
Sometimes I get greedy and just don't want to sell...
I want to protect myself from losses and still be able to make some trades
What does this do?
This script plots Fibonacci levels dynamically according to a specified length
It also has a smooting value so it looks a bit more clean (and allows for dynamic trailing stop loss)
Internal Fib levels allow to plot fibonacci levels between each main level (scalpers and day traders should be happy with this)
Fib Projection toggle so we can have "the same behaviour" during aggressive Bull Runs.
How to test this thing?
BTC USD Daily chart
For starters, use the following settings:
- Length: 365 (lookback of a full year)
- Smooth: 56 (8 week period)
- Inter Fib levels: OFF
- Fib projection: OFF
Have a look into the chart and check some support/resistance zones. Also check the behaviour of the indicator during the 2021 Jan -> Mar bull run (we will need it later)
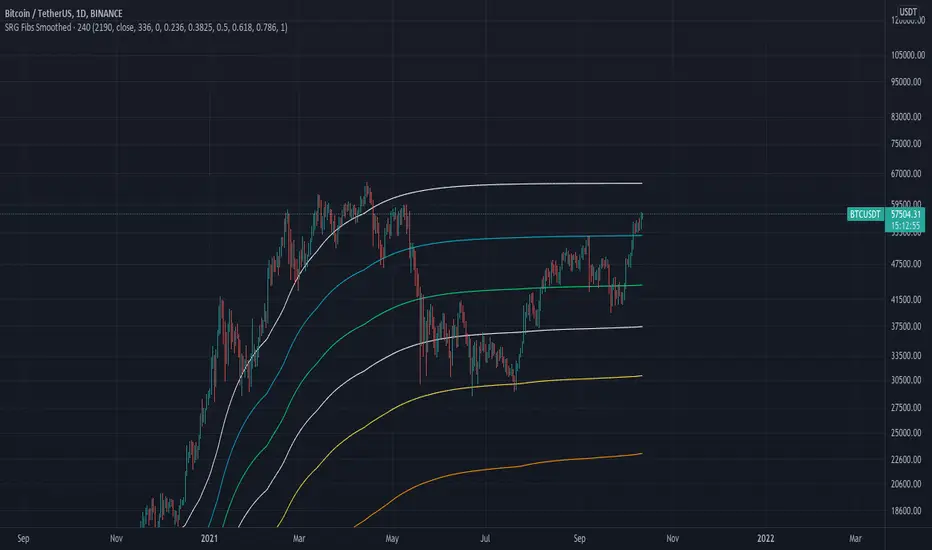
If you like to check different time frames. Use these settings:
- Indicator Timeframe: 4 hours
- Length: 2190 (1 year)
- Smooth: 336 (8 weeks)
- Inter Fib Levels: ON
- Fib Projection: OFF
You can now test the chart using the 2H timeframe to see the movement, and how the Internal Fib levels work
Now as we're getting bullish:
- Indicator Timeframe: 4 hours
- Length: 2190 (1 year)
- Smooth: 336 (8 weeks)
- Inter Fib Levels: OFF
- Fib Projection: ON
You can now check the behaviour of the indicator during the 2021 Jan - Mar Bullrun in the 2H or 4H chart, to see some stop loss magic.
Why did I code this?
I never know where is the best place to buy
Sometimes I get greedy and just don't want to sell...
I want to protect myself from losses and still be able to make some trades
What does this do?
This script plots Fibonacci levels dynamically according to a specified length
It also has a smooting value so it looks a bit more clean (and allows for dynamic trailing stop loss)
Internal Fib levels allow to plot fibonacci levels between each main level (scalpers and day traders should be happy with this)
Fib Projection toggle so we can have "the same behaviour" during aggressive Bull Runs.
How to test this thing?
BTC USD Daily chart
For starters, use the following settings:
- Length: 365 (lookback of a full year)
- Smooth: 56 (8 week period)
- Inter Fib levels: OFF
- Fib projection: OFF
Have a look into the chart and check some support/resistance zones. Also check the behaviour of the indicator during the 2021 Jan -> Mar bull run (we will need it later)
If you like to check different time frames. Use these settings:
- Indicator Timeframe: 4 hours
- Length: 2190 (1 year)
- Smooth: 336 (8 weeks)
- Inter Fib Levels: ON
- Fib Projection: OFF
You can now test the chart using the 2H timeframe to see the movement, and how the Internal Fib levels work
Now as we're getting bullish:
- Indicator Timeframe: 4 hours
- Length: 2190 (1 year)
- Smooth: 336 (8 weeks)
- Inter Fib Levels: OFF
- Fib Projection: ON
You can now check the behaviour of the indicator during the 2021 Jan - Mar Bullrun in the 2H or 4H chart, to see some stop loss magic.
오픈 소스 스크립트
트레이딩뷰의 진정한 정신에 따라, 이 스크립트의 작성자는 이를 오픈소스로 공개하여 트레이더들이 기능을 검토하고 검증할 수 있도록 했습니다. 작성자에게 찬사를 보냅니다! 이 코드는 무료로 사용할 수 있지만, 코드를 재게시하는 경우 하우스 룰이 적용된다는 점을 기억하세요.
면책사항
해당 정보와 게시물은 금융, 투자, 트레이딩 또는 기타 유형의 조언이나 권장 사항으로 간주되지 않으며, 트레이딩뷰에서 제공하거나 보증하는 것이 아닙니다. 자세한 내용은 이용 약관을 참조하세요.
오픈 소스 스크립트
트레이딩뷰의 진정한 정신에 따라, 이 스크립트의 작성자는 이를 오픈소스로 공개하여 트레이더들이 기능을 검토하고 검증할 수 있도록 했습니다. 작성자에게 찬사를 보냅니다! 이 코드는 무료로 사용할 수 있지만, 코드를 재게시하는 경우 하우스 룰이 적용된다는 점을 기억하세요.
면책사항
해당 정보와 게시물은 금융, 투자, 트레이딩 또는 기타 유형의 조언이나 권장 사항으로 간주되지 않으며, 트레이딩뷰에서 제공하거나 보증하는 것이 아닙니다. 자세한 내용은 이용 약관을 참조하세요.