OPEN-SOURCE SCRIPT
업데이트됨 Murrey Math Horizontal/Diagonal + Subharmonics 0 - 12 [All-Time]
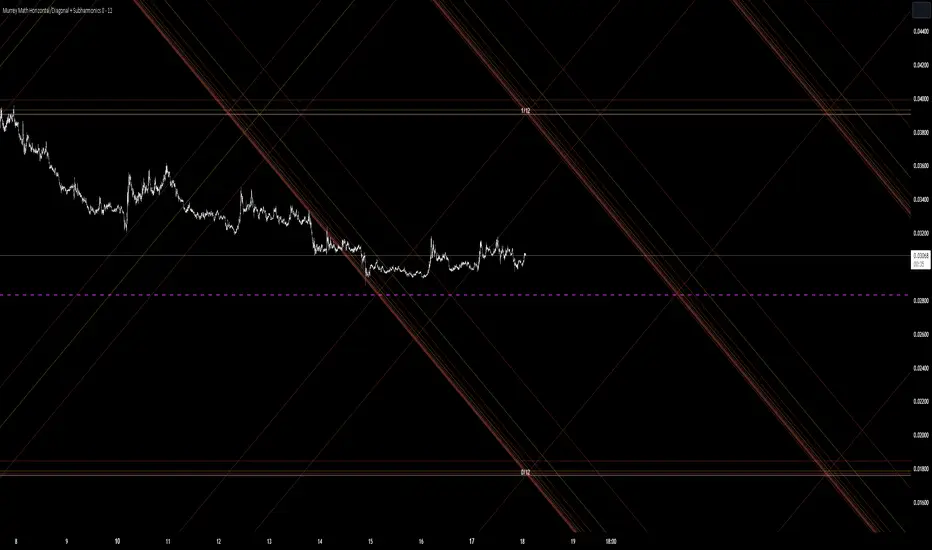
The Murrey Math lines are created by dividing the range between the high and low of the monthly timeframe prices into equal parts based on the division factor from 2 to 12.
No matter which timeframe you will use, because the calculations based on the most high and low price values.
Better to use > monthly timeframe for faster calculations.
These lines serve as potential support and resistance levels.
The midlines are dashed lines representing the midpoint between two consecutive Murrey Math lines.
The diagonal lines can be enabled to show two different types or both types. These lines connect the highs or lows of the price bars in a diagonal manner.
The subharmonic lines represent smaller divisions within each Murrey Math range. They can be customized to show only strong subharmonics or all subharmonics. Subharmonics are calculated based on the division factor and can provide additional support and resistance levels within the Murrey Math framework.
This script helps visualize the Murrey Math levels and their associated lines on a trading chart, aiding traders in identifying potential price levels for decision-making.
The most strong levels which I tested were: 2, 4, 6, 8, 12.
I was inspired by Gann's work and i tried to implement this indicator.
It's the most accurate version of Murrey Math calculations, you can set the value of 8 which Gann was used but I did up to 12 because of my experiments and I would recommend you to use the value of 12.
This indicator can be used for all types of markets.
Also note, that the strong levels described above is tested on division by 12 setting.
Anyway, you can use the divison of 8 and use the standart strong s/r levels.
(for more information search for Gann 2.0 support resistance on the internet).
Also note: this information is not a financial advice, just my opinion to the indicator I implemented. Please use this indicator wisely and focus to save your money, not earn.
I wish you profitable trades, stick to your risk/money management and the key entry points!
릴리즈 노트
Request by ulomadgreat:
- Added ability to show prices of main harmonics (default set to true).
Enjoy.
오픈 소스 스크립트
트레이딩뷰의 진정한 정신에 따라, 이 스크립트의 작성자는 이를 오픈소스로 공개하여 트레이더들이 기능을 검토하고 검증할 수 있도록 했습니다. 작성자에게 찬사를 보냅니다! 이 코드는 무료로 사용할 수 있지만, 코드를 재게시하는 경우 하우스 룰이 적용된다는 점을 기억하세요.
면책사항
해당 정보와 게시물은 금융, 투자, 트레이딩 또는 기타 유형의 조언이나 권장 사항으로 간주되지 않으며, 트레이딩뷰에서 제공하거나 보증하는 것이 아닙니다. 자세한 내용은 이용 약관을 참조하세요.
오픈 소스 스크립트
트레이딩뷰의 진정한 정신에 따라, 이 스크립트의 작성자는 이를 오픈소스로 공개하여 트레이더들이 기능을 검토하고 검증할 수 있도록 했습니다. 작성자에게 찬사를 보냅니다! 이 코드는 무료로 사용할 수 있지만, 코드를 재게시하는 경우 하우스 룰이 적용된다는 점을 기억하세요.
면책사항
해당 정보와 게시물은 금융, 투자, 트레이딩 또는 기타 유형의 조언이나 권장 사항으로 간주되지 않으며, 트레이딩뷰에서 제공하거나 보증하는 것이 아닙니다. 자세한 내용은 이용 약관을 참조하세요.