OPEN-SOURCE SCRIPT
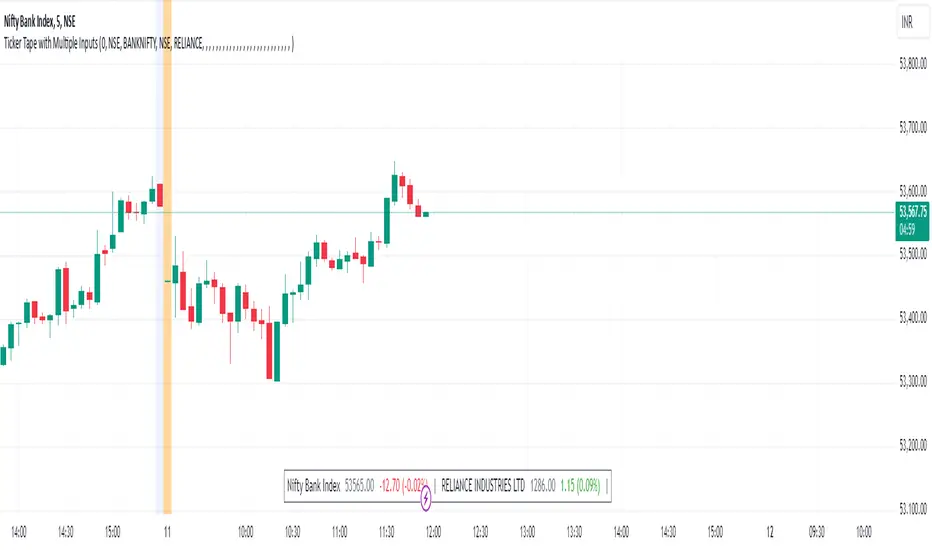
Ticker Tape with Multiple Inputs
# Ticker Tape
A customizable multi-symbol price tracker that displays real-time price information in a scrolling ticker format, similar to financial news tickers.
This indicator is inspired from Tradingciew's default tickertape indicator with changes in the way inputs are given.
### Overview
This indicator allows you to monitor up to 15 different symbols simultaneously across any supported exchanges on TradingView. It displays essential price information including current price, price change, and percentage change in an easy-to-read format at the bottom of your chart.
### Features
• Monitor up to 15 different symbols simultaneously
• Support for any exchange available on TradingView
• Real-time price updates
• Color-coded price changes (green for increase, red for decrease)
• Smooth scrolling animation (can be disabled)
• Customizable scroll speed and position offset
### Input Parameters
#### Ticker Tape Controls
• Running: Enable/disable the scrolling animation
• Offset: Adjust the starting position of the ticker tape
#### Symbol Settings
• Exchange (1-15): Enter the exchange name (e.g., NSE, BINANCE, NYSE)
• Symbol (1-15): Enter the symbol name (e.g., BANKNIFTY, RELIANCE, BTCUSDT)
### Display Format
For each symbol, the ticker shows:
1. Symbol Name
2. Current Price
3. Price Change (Absolute and Percentage)
### Example Usage
Input Settings:
Exchange 1: NSE
Symbol 1: BANKNIFTY
Exchange 2: NSE
Symbol 2: RELIANCE
The ticker tape will display:
`NIFTY BANK 46750.00 +350.45 (0.75%) | RELIANCE 2456.85 -12.40 (-0.50%) |`
### Use Cases
1. Multi-Market Monitoring: Track different markets simultaneously without switching between charts
2. Portfolio Tracking: Monitor all your positions in real-time
### Tips for Best Use
1. Group related symbols together for easier monitoring
2. Use the offset parameter to position important symbols in your preferred viewing area
3. Disable scrolling if you prefer a static display
4. Leave exchange field empty for default exchange symbols
### Notes
• Price updates occur in real-time during market hours
• Color coding helps quickly identify price direction
• The indicator adapts to any chart timeframe
• Empty input pairs are automatically skipped
### Performance Considerations
The indicator is optimized for efficiency, but monitoring too many high-frequency symbols might impact chart performance. It's recommended to use only the symbols you actively need to monitor.
Version: 2.0 Stock_Cloud
Last Updated: December 2024
오픈 소스 스크립트
트레이딩뷰의 진정한 정신에 따라, 이 스크립트의 작성자는 이를 오픈소스로 공개하여 트레이더들이 기능을 검토하고 검증할 수 있도록 했습니다. 작성자에게 찬사를 보냅니다! 이 코드는 무료로 사용할 수 있지만, 코드를 재게시하는 경우 하우스 룰이 적용된다는 점을 기억하세요.
면책사항
해당 정보와 게시물은 금융, 투자, 트레이딩 또는 기타 유형의 조언이나 권장 사항으로 간주되지 않으며, 트레이딩뷰에서 제공하거나 보증하는 것이 아닙니다. 자세한 내용은 이용 약관을 참조하세요.
오픈 소스 스크립트
트레이딩뷰의 진정한 정신에 따라, 이 스크립트의 작성자는 이를 오픈소스로 공개하여 트레이더들이 기능을 검토하고 검증할 수 있도록 했습니다. 작성자에게 찬사를 보냅니다! 이 코드는 무료로 사용할 수 있지만, 코드를 재게시하는 경우 하우스 룰이 적용된다는 점을 기억하세요.
면책사항
해당 정보와 게시물은 금융, 투자, 트레이딩 또는 기타 유형의 조언이나 권장 사항으로 간주되지 않으며, 트레이딩뷰에서 제공하거나 보증하는 것이 아닙니다. 자세한 내용은 이용 약관을 참조하세요.