OPEN-SOURCE SCRIPT
업데이트됨 4x Stochastic and 1x RSI Buy and Sell Signals
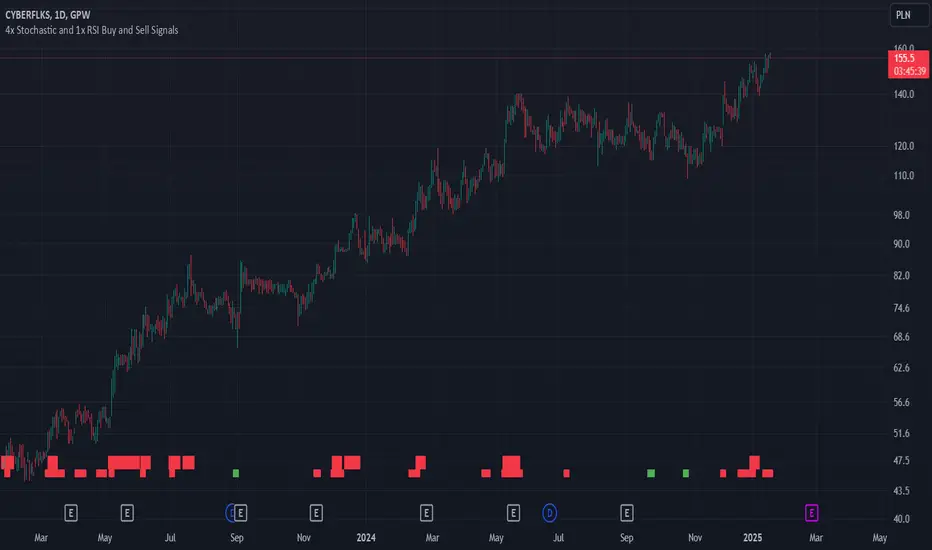
Buy signal (green), when Stochastic 9, 14, 40 and 60 are bellow 20.
Sell signal (red), when Stochastic 9, 14, 40 and 60 are above 80.
Buy signal is larger, when RSI is also bellow 30.
Sell signal is larger, when RSI is also above 70.
Using RSI is optional and can be disabled.
Use this signals when confirmed by another indicators, like support and resistance levels, EMAs and fundamental analysis.
릴리즈 노트
The script was created to simplify the analysis of four Stochastic indicators and one RSI simultaneously, combining them into a single coherent buy or sell signal. The script is suitable for trading any asset: stocks, futures, currencies. The goal is to identify a local price low or high to indicate a potential moment for buying or selling (long or short positions).The intended use of the script assumes the simultaneous utilization of four Stochastic indicators on four different timeframes. By default, these are 9, 14, 40, and 60. The indicator helps identify price lows or highs if all four Stochastic indicators are below 20 or above 80.
- Buy Signal (green rectangle at the bottom of the screen): Triggered when all four Stochastic indicators are below 20.
- Sell Signal (red rectangle at the bottom of the screen): Triggered when all four Stochastic indicators are above 80.
An additional optional parameter is the RSI, which serves to strengthen the signal from the Stochastic indicators. If the Stochastic indicators show a buy or sell signal and the RSI simultaneously indicates oversold or overbought conditions, the buy or sell signal is displayed as a larger rectangle at the bottom of the screen.
Usage Strategy:
Looking for deeper price lows or highs should be supplemented with confirmation from other methods. Recommended tools include Price Action analysis, support and resistance analysis, and fundamental analysis of the company.
릴리즈 노트
I added an option to disable the display of sell signals (red). As a result, only buy signals (green) appear.Strategy for the stock market:
The option to disable sell signals is useful in the stock market, as the stocks of good companies are typically in a long-term upward trend, leading to frequent false sell signals. Growth stocks tend to remain in the upper ranges of the Stochastic and often the RSI for extended periods. This is not a sell signal.
Strategy for currencies, commodities, and short selling:
Both sell and buy signals will be useful in these cases.
오픈 소스 스크립트
트레이딩뷰의 진정한 정신에 따라, 이 스크립트의 작성자는 이를 오픈소스로 공개하여 트레이더들이 기능을 검토하고 검증할 수 있도록 했습니다. 작성자에게 찬사를 보냅니다! 이 코드는 무료로 사용할 수 있지만, 코드를 재게시하는 경우 하우스 룰이 적용된다는 점을 기억하세요.
면책사항
해당 정보와 게시물은 금융, 투자, 트레이딩 또는 기타 유형의 조언이나 권장 사항으로 간주되지 않으며, 트레이딩뷰에서 제공하거나 보증하는 것이 아닙니다. 자세한 내용은 이용 약관을 참조하세요.
오픈 소스 스크립트
트레이딩뷰의 진정한 정신에 따라, 이 스크립트의 작성자는 이를 오픈소스로 공개하여 트레이더들이 기능을 검토하고 검증할 수 있도록 했습니다. 작성자에게 찬사를 보냅니다! 이 코드는 무료로 사용할 수 있지만, 코드를 재게시하는 경우 하우스 룰이 적용된다는 점을 기억하세요.
면책사항
해당 정보와 게시물은 금융, 투자, 트레이딩 또는 기타 유형의 조언이나 권장 사항으로 간주되지 않으며, 트레이딩뷰에서 제공하거나 보증하는 것이 아닙니다. 자세한 내용은 이용 약관을 참조하세요.