OPEN-SOURCE SCRIPT
IU Support and Resistance
How this script works :
1. This script is an indicator script which calculates the support and resistance based on pivot high and pivot low and plot them as zone onto the chart.
2. The first user input is minimum number of touches which indicates how many time pivot high or pivot low should be tested in order to be a valid support or resistance level.
3.The second user input "Set Buffer" check if the user wants to use a custom buffer or not if it's unchanged then the default is 50% of the 1000 period ATR value .
4. If "Set Buffer" is checked meaning if it's set to true then only the third user input will be execute which is the "buffer" which indicates how much price range user wants his zone to have.
5. After the user input part this script create two arrays to store the pivot high and pivot low values every time he have a new value.
6. This script also creates two arrays to store the bar index of the bar where the new pivot high or pivot low is detected those bar index will be later use while creating the support and resistance zones.
7. Then the script creates four more arrays to store the final support and resistance values and their respective bar index which will be use for creating the support and resistance zones.
8. After this the script check that we are at the last bar of our chart if we are then we sort the support and resistance indices by descending order and store them into an new variable after that we sort the support and resistance arrays by descending order, then we loop through the arrays elements and we check if the previous element comes under the zone of the current element if so we increase the "minimum touch" variable by 1, once we have 5 or more count in our variable and we no longer have a valid zone then we store the element value and the sorted index of the element into our final arrays.
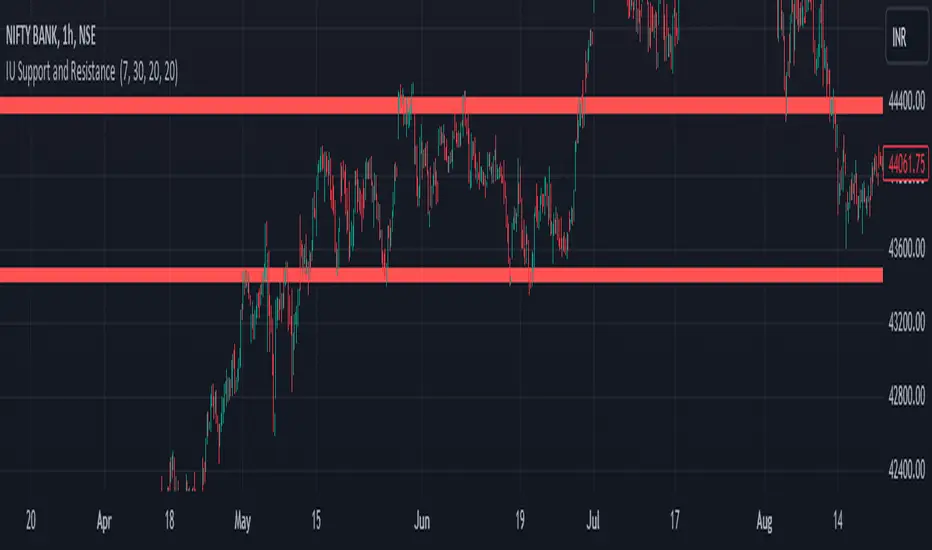
9. Finally the script will loop through the final support and resistance arrays and it will create a box for each support and resistance with respect to extending it on both directions.
10.The green zones are the support and the red zones are the resistance.
How user can benifits from this script:
1. User can automatically identify support and resistance zones and he can plan his trade as per that.
2. User can test how different markets reacts with support and resistance zones.
3. User can plan breakout trade on the break of the support or resistance level.
4. User can adjust he stop loss and take profit as per the support and resistance zones.
1. This script is an indicator script which calculates the support and resistance based on pivot high and pivot low and plot them as zone onto the chart.
2. The first user input is minimum number of touches which indicates how many time pivot high or pivot low should be tested in order to be a valid support or resistance level.
3.The second user input "Set Buffer" check if the user wants to use a custom buffer or not if it's unchanged then the default is 50% of the 1000 period ATR value .
4. If "Set Buffer" is checked meaning if it's set to true then only the third user input will be execute which is the "buffer" which indicates how much price range user wants his zone to have.
5. After the user input part this script create two arrays to store the pivot high and pivot low values every time he have a new value.
6. This script also creates two arrays to store the bar index of the bar where the new pivot high or pivot low is detected those bar index will be later use while creating the support and resistance zones.
7. Then the script creates four more arrays to store the final support and resistance values and their respective bar index which will be use for creating the support and resistance zones.
8. After this the script check that we are at the last bar of our chart if we are then we sort the support and resistance indices by descending order and store them into an new variable after that we sort the support and resistance arrays by descending order, then we loop through the arrays elements and we check if the previous element comes under the zone of the current element if so we increase the "minimum touch" variable by 1, once we have 5 or more count in our variable and we no longer have a valid zone then we store the element value and the sorted index of the element into our final arrays.
9. Finally the script will loop through the final support and resistance arrays and it will create a box for each support and resistance with respect to extending it on both directions.
10.The green zones are the support and the red zones are the resistance.
How user can benifits from this script:
1. User can automatically identify support and resistance zones and he can plan his trade as per that.
2. User can test how different markets reacts with support and resistance zones.
3. User can plan breakout trade on the break of the support or resistance level.
4. User can adjust he stop loss and take profit as per the support and resistance zones.
오픈 소스 스크립트
트레이딩뷰의 진정한 정신에 따라, 이 스크립트의 작성자는 이를 오픈소스로 공개하여 트레이더들이 기능을 검토하고 검증할 수 있도록 했습니다. 작성자에게 찬사를 보냅니다! 이 코드는 무료로 사용할 수 있지만, 코드를 재게시하는 경우 하우스 룰이 적용된다는 점을 기억하세요.
Shivam mandai
면책사항
해당 정보와 게시물은 금융, 투자, 트레이딩 또는 기타 유형의 조언이나 권장 사항으로 간주되지 않으며, 트레이딩뷰에서 제공하거나 보증하는 것이 아닙니다. 자세한 내용은 이용 약관을 참조하세요.
오픈 소스 스크립트
트레이딩뷰의 진정한 정신에 따라, 이 스크립트의 작성자는 이를 오픈소스로 공개하여 트레이더들이 기능을 검토하고 검증할 수 있도록 했습니다. 작성자에게 찬사를 보냅니다! 이 코드는 무료로 사용할 수 있지만, 코드를 재게시하는 경우 하우스 룰이 적용된다는 점을 기억하세요.
Shivam mandai
면책사항
해당 정보와 게시물은 금융, 투자, 트레이딩 또는 기타 유형의 조언이나 권장 사항으로 간주되지 않으며, 트레이딩뷰에서 제공하거나 보증하는 것이 아닙니다. 자세한 내용은 이용 약관을 참조하세요.