INVITE-ONLY SCRIPT
업데이트됨 Price Action and market structure [Tcs] | PA
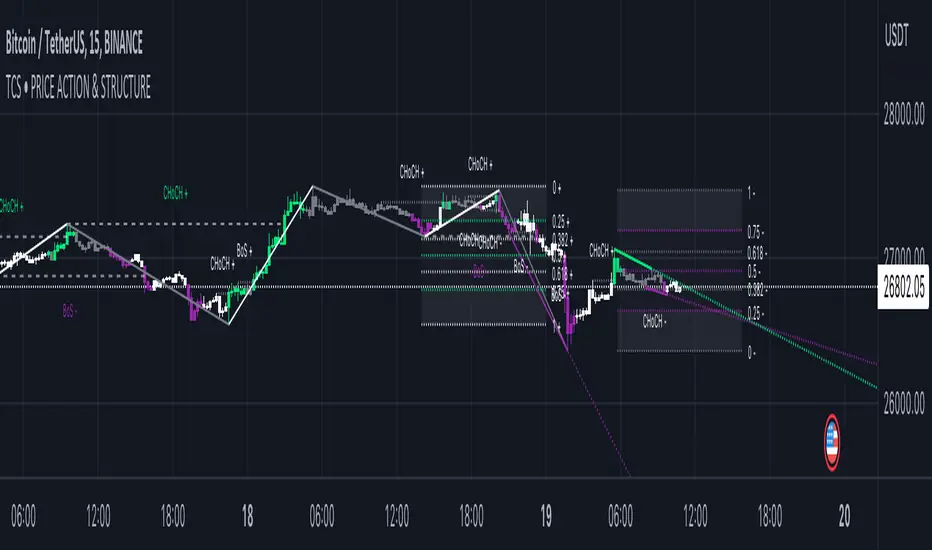
This indicator shows in real time the clearest and most complete vision of the price market structure, without considering volumes.
It has been developed mainly to identify price retracements in order to find the best entries in the market, but it include also other features which can be helpful for traders.
The indicator detects and highlight on the chart the market movement in multiple ways, including swing high, swing lows, the break of structure (BoS), change of character (CoCh), possible retracement movement, trend-lines generated through pivots, fibonacci and quarters theory levels based on previous pivot and daily, weekly and monthly highs and lows.
It can be set up on two different pivots look-back, one faster and one slower, to simplify the development of strategies for traders.
A longer look-back can detect a "slower" and less noisy structure, which can be more useful to detect massive retracements, while a shorter look-back can be useful to detect faster market moves, perfect for scalpers and to develop small price movement strategies.
Indicator features:
- Trend detection highlighted with colors - candles are colored in four different colors, and it's possible to choose if detect the fast and slow trend:
• Bullish move after structure break – green
• Bullish retracements – gray
• Bearish move after structure break – purple
• Bearish retracements – white

In this way traders can have a realtime vision of when the market is retracing in order to find better entries than entry immediately on a break of structure. It can be integrated with order blocks, ema or others indicators which can be helpful as support or resistance.
- Pivots and structure labels - in order to identify immediately if the trend is bullish, bearish or is changing direction:
• BoS + and BoS - are the bullish and bearish break of structure, respectively, and are colored to indicate a slower look-back, in gray to indicate a faster pivot look-back
• CoCh + and CoCh - are the bullish and bearish change of characters, respectively, and are colored to indicate a slower look-back.
• HH, HL, LL, and LH indicate the pivots of the trend. Al the pivots appear just when the pivots, based on fast or slow pivot look-back are confirmed

- Zigzag - The zigzag line helps to remove market noise and read the market structure in a simpler way.
• It's possible to select the zigzag line based on the slow or fast trend.
• Fast pivot look-back

•Slow pivot look-back

- Quarters theory and Fibonacci retracement:
• It creates a retracement that can be based on the fast or slow trend and small or big market move.
• The retracement is both bullish and bearish and includes the major Fibonacci levels and the most valuable areas from the quarters theory of market retracement.
• This helps to detect good entry points.

- Support and resistance, Daily, weekly, and monthly high, lows - just to heave a more clear view of important levels:
• It plots the highest and lowest pivot points based on the selected look-back.
• It plots the highs and lows of the day, week, and month.

- Trendlines:
• It plots the trend-lines based on past pivots.
• Here as well, it is possible to choose between fast and slow trend pivot look-back.

It's important to highlight that the indicator remarks on all facets of pure price action, not the smart money concept or liquidity areas.
Please note that this indicator is for educational purposes only and should not be used for trading without further testing and analysis.
It has been developed mainly to identify price retracements in order to find the best entries in the market, but it include also other features which can be helpful for traders.
The indicator detects and highlight on the chart the market movement in multiple ways, including swing high, swing lows, the break of structure (BoS), change of character (CoCh), possible retracement movement, trend-lines generated through pivots, fibonacci and quarters theory levels based on previous pivot and daily, weekly and monthly highs and lows.
It can be set up on two different pivots look-back, one faster and one slower, to simplify the development of strategies for traders.
A longer look-back can detect a "slower" and less noisy structure, which can be more useful to detect massive retracements, while a shorter look-back can be useful to detect faster market moves, perfect for scalpers and to develop small price movement strategies.
Indicator features:
- Trend detection highlighted with colors - candles are colored in four different colors, and it's possible to choose if detect the fast and slow trend:
• Bullish move after structure break – green
• Bullish retracements – gray
• Bearish move after structure break – purple
• Bearish retracements – white
In this way traders can have a realtime vision of when the market is retracing in order to find better entries than entry immediately on a break of structure. It can be integrated with order blocks, ema or others indicators which can be helpful as support or resistance.
- Pivots and structure labels - in order to identify immediately if the trend is bullish, bearish or is changing direction:
• BoS + and BoS - are the bullish and bearish break of structure, respectively, and are colored to indicate a slower look-back, in gray to indicate a faster pivot look-back
• CoCh + and CoCh - are the bullish and bearish change of characters, respectively, and are colored to indicate a slower look-back.
• HH, HL, LL, and LH indicate the pivots of the trend. Al the pivots appear just when the pivots, based on fast or slow pivot look-back are confirmed
- Zigzag - The zigzag line helps to remove market noise and read the market structure in a simpler way.
• It's possible to select the zigzag line based on the slow or fast trend.
• Fast pivot look-back
•Slow pivot look-back
- Quarters theory and Fibonacci retracement:
• It creates a retracement that can be based on the fast or slow trend and small or big market move.
• The retracement is both bullish and bearish and includes the major Fibonacci levels and the most valuable areas from the quarters theory of market retracement.
• This helps to detect good entry points.
- Support and resistance, Daily, weekly, and monthly high, lows - just to heave a more clear view of important levels:
• It plots the highest and lowest pivot points based on the selected look-back.
• It plots the highs and lows of the day, week, and month.
- Trendlines:
• It plots the trend-lines based on past pivots.
• Here as well, it is possible to choose between fast and slow trend pivot look-back.
It's important to highlight that the indicator remarks on all facets of pure price action, not the smart money concept or liquidity areas.
Please note that this indicator is for educational purposes only and should not be used for trading without further testing and analysis.
릴리즈 노트
• Fixed some bugs on candle colors settings• Added alert conditions on structure breaks both for "fast structure" and "slow structure"
초대 전용 스크립트
이 스크립트는 작성자가 승인한 사용자만 접근할 수 있습니다. 사용하려면 요청 후 승인을 받아야 하며, 일반적으로 결제 후에 허가가 부여됩니다. 자세한 내용은 아래 작성자의 안내를 따르거나 zendrer에게 직접 문의하세요.
트레이딩뷰는 스크립트의 작동 방식을 충분히 이해하고 작성자를 완전히 신뢰하지 않는 이상, 해당 스크립트에 비용을 지불하거나 사용하는 것을 권장하지 않습니다. 커뮤니티 스크립트에서 무료 오픈소스 대안을 찾아보실 수도 있습니다.
작성자 지시 사항
You can find all the necessary info in the website http://www.thecryptostrategist.com
For the access to premium indicators please contact me on tradingview
면책사항
해당 정보와 게시물은 금융, 투자, 트레이딩 또는 기타 유형의 조언이나 권장 사항으로 간주되지 않으며, 트레이딩뷰에서 제공하거나 보증하는 것이 아닙니다. 자세한 내용은 이용 약관을 참조하세요.